
MATLAB: An Introduction with Applications
6th Edition
ISBN: 9781119256830
Author: Amos Gilat
Publisher: John Wiley & Sons Inc
expand_more
expand_more
format_list_bulleted
Related questions
Concept explainers
Question
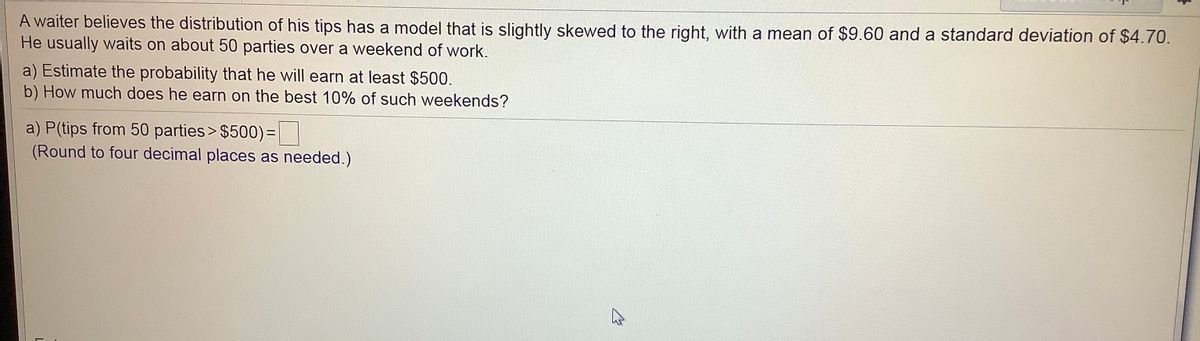

Transcribed Image Text:A waiter believes the distribution of his tips has a model that is slightly skewed to the right, with a mean of $9.60 and a standard deviation of $4.70.
He usually waits on about 50 parties over a weekend of work.
a) Estimate the probability that he will earn at least $500.
b) How much does he earn on the best 10% of such weekends?
a) P(tips from 50 parties> $500)=|
(Round to four decimal places as needed.)
Expert Solution
This question has been solved!
Explore an expertly crafted, step-by-step solution for a thorough understanding of key concepts.

This is a popular solution

Trending nowThis is a popular solution!

Step by stepSolved in 2 steps

Knowledge Booster


Learn more about
Need a deep-dive on the concept behind this application? Look no further. Learn more about this topic, statistics and related others by exploring similar questions and additional content below.Similar questions
- a. The mean of this distribution is b. The standard deviation is c. The probability that the the child will be older than 5 years old?arrow_forwardA waiterbelieves the distribution of his tips has a model that is slightly skewed to the left, with a mean of $8.60 and a standard deviation of $4.20. He usually waits on about 50 parties over a weekend of work. a) Estimate the probability that he will earn at least $450. b) How much does he earn on the best 5% of such weekends?arrow_forwardSuppose that the distance of fly balls hit to the outfield (in baseball) is normally distributed with a mean of 254 feet and a standard deviation of 43 feet. Use your graphing calculator to answer the following questions. Write your answers in percent form. Round your answers to the nearest tenth of a percent. a) If one fly ball is randomly chosen from this distribution, what is the probability that this ball traveled fewer than 204 feet? P(fewer than 204 feet) = % b) If one fly ball is randomly chosen from this distribution, what is the probability that this ball traveled more than 216 feet? P(more than 216 feet) =arrow_forward
- In a normal distribution, what z-score cuts off the top 65% of the distribution?a. z = 0.7422b. z = 0.2578c. z =0.39d. z = -0.39arrow_forwardThe time between arrivals of vehicles at a particular intersection follows an exponential probability distribution with a mean of 12 seconds. A. IN EXCEL sketch this exponential distribution, and Standard deviation. B. IN EXCEL What is the probability that the arrival time between vehicles is 12 seconds or less. C. IN EXCEL What is the probability that the arrival time between vehicles is 6 seconds or less.arrow_forwardcan you help answer a. b. carrow_forward
- Sixty-two percent of seniors attend a particular school in a school district. Assume 500 seniors within this school district are sampled. a. Can this distribution be approximated using the Normal model? Explain. b. Use the Normal approximation to estimate the probability that at least 290 senior students are enrolled at this particular school. c. Use the Normal model to estimate the probability that between 200 and 300 senior students who are sampled are enrolled at this particular school.arrow_forwardThe standard deviation of a variable that has a normal distribution controls? a. The spread of the curve and is interpreted as the typical distance and observation is from the mean b. The spread of the curve and is interpreted as the typical outcome c. The probability is equivalent to the binomial formula calculation, but very rare d. The location of the curve and is interpreted as the mean or average outcomearrow_forwardThe NJ Department of Health has reported the average life span of NJ residents is 81 years. If the standard deviation is σ = 4 years, what is the probability of a person living to at least 92 years of age?arrow_forward
- Scores on in biology tests are normally distributed with the mean of 78 in a standard deviation of 8.2 find the score that represents the 61st percentilearrow_forwardThe distances golf balls travel under laboratory testing conditions are normally distributed. The mean is 312 yards. The probability the golf ball travels further than 319 yards is 0.28. Find the probability a randomly selected golf ball travels between 305 yards and 319 yards. Express the answer as a decimal value rounded to the nearest hundredth.arrow_forward
arrow_back_ios
arrow_forward_ios
Recommended textbooks for you
- MATLAB: An Introduction with ApplicationsStatisticsISBN:9781119256830Author:Amos GilatPublisher:John Wiley & Sons Inc
 Probability and Statistics for Engineering and th...StatisticsISBN:9781305251809Author:Jay L. DevorePublisher:Cengage Learning
 Statistics for The Behavioral Sciences (MindTap C...StatisticsISBN:9781305504912Author:Frederick J Gravetter, Larry B. WallnauPublisher:Cengage Learning
  Elementary Statistics: Picturing the World (7th E...StatisticsISBN:9780134683416Author:Ron Larson, Betsy FarberPublisher:PEARSON
 The Basic Practice of StatisticsStatisticsISBN:9781319042578Author:David S. Moore, William I. Notz, Michael A. FlignerPublisher:W. H. Freeman
 Introduction to the Practice of StatisticsStatisticsISBN:9781319013387Author:David S. Moore, George P. McCabe, Bruce A. CraigPublisher:W. H. Freeman
MATLAB: An Introduction with Applications
Statistics
ISBN:9781119256830
Author:Amos Gilat
Publisher:John Wiley & Sons Inc
Probability and Statistics for Engineering and th...
Statistics
ISBN:9781305251809
Author:Jay L. Devore
Publisher:Cengage Learning
Statistics for The Behavioral Sciences (MindTap C...
Statistics
ISBN:9781305504912
Author:Frederick J Gravetter, Larry B. Wallnau
Publisher:Cengage Learning
Elementary Statistics: Picturing the World (7th E...
Statistics
ISBN:9780134683416
Author:Ron Larson, Betsy Farber
Publisher:PEARSON
The Basic Practice of Statistics
Statistics
ISBN:9781319042578
Author:David S. Moore, William I. Notz, Michael A. Fligner
Publisher:W. H. Freeman
Introduction to the Practice of Statistics
Statistics
ISBN:9781319013387
Author:David S. Moore, George P. McCabe, Bruce A. Craig
Publisher:W. H. Freeman