
MATLAB: An Introduction with Applications
6th Edition
ISBN: 9781119256830
Author: Amos Gilat
Publisher: John Wiley & Sons Inc
expand_more
expand_more
format_list_bulleted
Related questions
Question
Question 16: give the conclusion
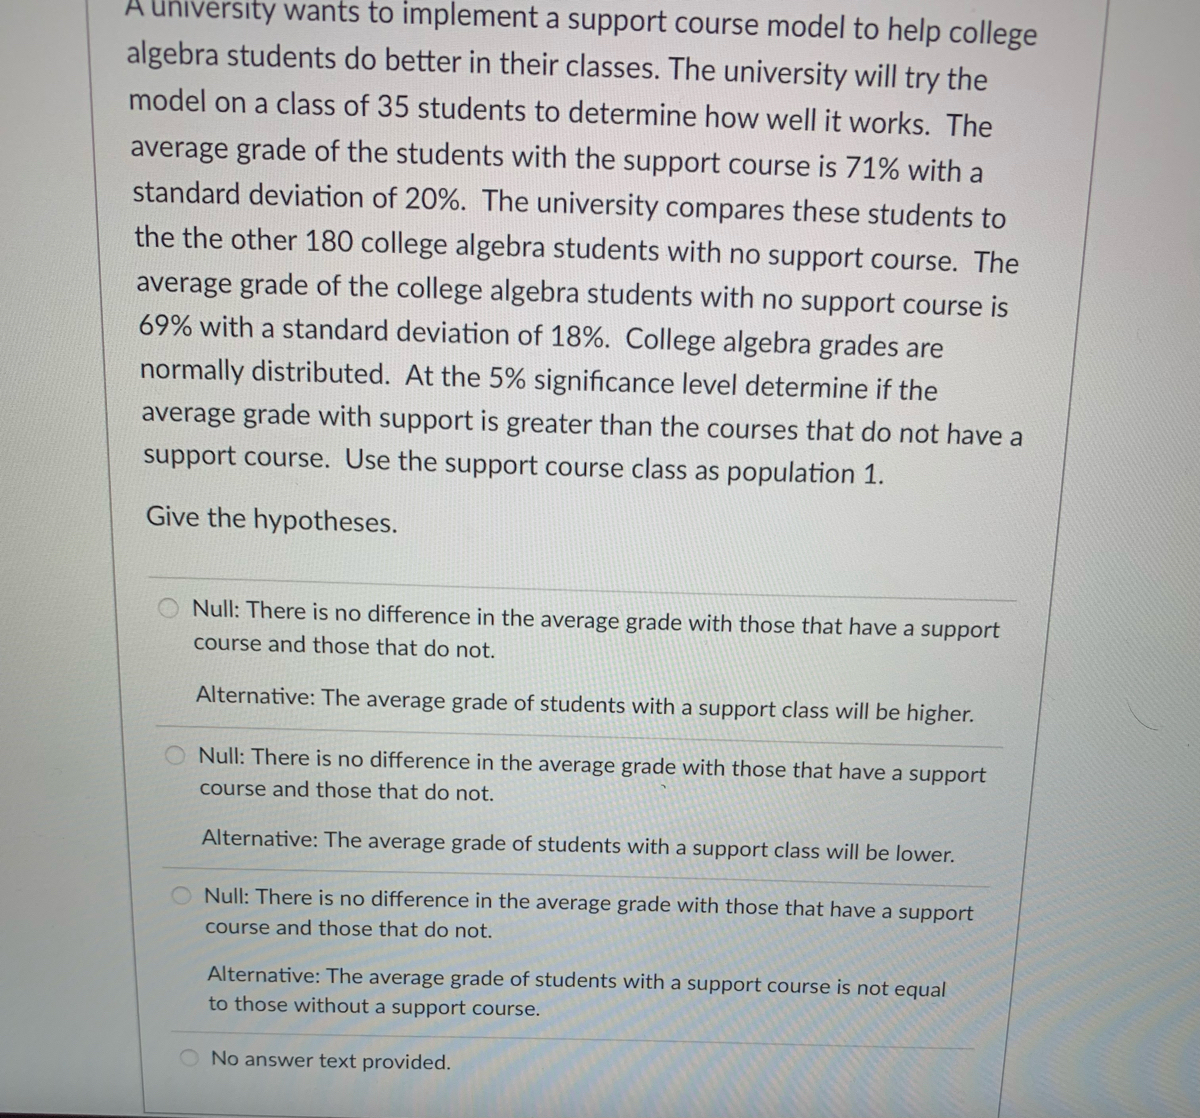

Transcribed Image Text:A university wants to implement a support course model to help college
algebra students do better in their classes. The university will try the
model on a class of 35 students to determine how well it works. The
average grade of the students with the support course is 71% with a
standard deviation of 20%. The university compares these students to
the the other 180 college algebra students with no support course. The
average grade of the college algebra students with no support course is
69% with a standard deviation of 18%. College algebra grades are
normally distributed. At the 5% significance level determine if the
average grade with support is greater than the courses that do not have a
support course. Use the support course class as population 1.
Give the hypotheses.
Null: There is no difference in the average grade with those that have a support
course and those that do not.
Alternative: The average grade of students with a support class will be higher.
O Null: There is no difference in the average grade with those that have a support
course and those that do not.
Alternative: The average grade of students with a support class will be lower.
O Null: There is no difference in the average grade with those that have a support
course and those that do not.
Alternative: The average grade of students with a support course is not equal
to those without a support course.
No answer text provided.

Transcribed Image Text:Give the conclusion.
Reject the null since the test statistic is in the rejection region.
Fail to reject the null since the test statistic is not in the rejection region.
Expert Solution
This question has been solved!
Explore an expertly crafted, step-by-step solution for a thorough understanding of key concepts.

This is a popular solution

Trending nowThis is a popular solution!

Step by stepSolved in 3 steps with 2 images

Knowledge Booster

Similar questions
- Let C= 3 5 6 - 5 -5. Find 3C. -4-3 3C = []arrow_forwardscored above 640. c. There are ten teaching assistants available for grading papers in a calculus course at a large university. The first exam consists of four questions, and the professor wishes to select a different assistant to grade each question (only one assistant per question). In how many ways can the assistant be chosen for grading Question 6arrow_forwardThe first part to find (a.) was right, but the next part (b.) was marked wrong.arrow_forward
arrow_back_ios
arrow_forward_ios
Recommended textbooks for you
- MATLAB: An Introduction with ApplicationsStatisticsISBN:9781119256830Author:Amos GilatPublisher:John Wiley & Sons Inc
 Probability and Statistics for Engineering and th...StatisticsISBN:9781305251809Author:Jay L. DevorePublisher:Cengage Learning
 Statistics for The Behavioral Sciences (MindTap C...StatisticsISBN:9781305504912Author:Frederick J Gravetter, Larry B. WallnauPublisher:Cengage Learning
  Elementary Statistics: Picturing the World (7th E...StatisticsISBN:9780134683416Author:Ron Larson, Betsy FarberPublisher:PEARSON
 The Basic Practice of StatisticsStatisticsISBN:9781319042578Author:David S. Moore, William I. Notz, Michael A. FlignerPublisher:W. H. Freeman
 Introduction to the Practice of StatisticsStatisticsISBN:9781319013387Author:David S. Moore, George P. McCabe, Bruce A. CraigPublisher:W. H. Freeman
MATLAB: An Introduction with Applications
Statistics
ISBN:9781119256830
Author:Amos Gilat
Publisher:John Wiley & Sons Inc
Probability and Statistics for Engineering and th...
Statistics
ISBN:9781305251809
Author:Jay L. Devore
Publisher:Cengage Learning
Statistics for The Behavioral Sciences (MindTap C...
Statistics
ISBN:9781305504912
Author:Frederick J Gravetter, Larry B. Wallnau
Publisher:Cengage Learning
Elementary Statistics: Picturing the World (7th E...
Statistics
ISBN:9780134683416
Author:Ron Larson, Betsy Farber
Publisher:PEARSON
The Basic Practice of Statistics
Statistics
ISBN:9781319042578
Author:David S. Moore, William I. Notz, Michael A. Fligner
Publisher:W. H. Freeman
Introduction to the Practice of Statistics
Statistics
ISBN:9781319013387
Author:David S. Moore, George P. McCabe, Bruce A. Craig
Publisher:W. H. Freeman