
MATLAB: An Introduction with Applications
6th Edition
ISBN: 9781119256830
Author: Amos Gilat
Publisher: John Wiley & Sons Inc
expand_more
expand_more
format_list_bulleted
Related questions
Question
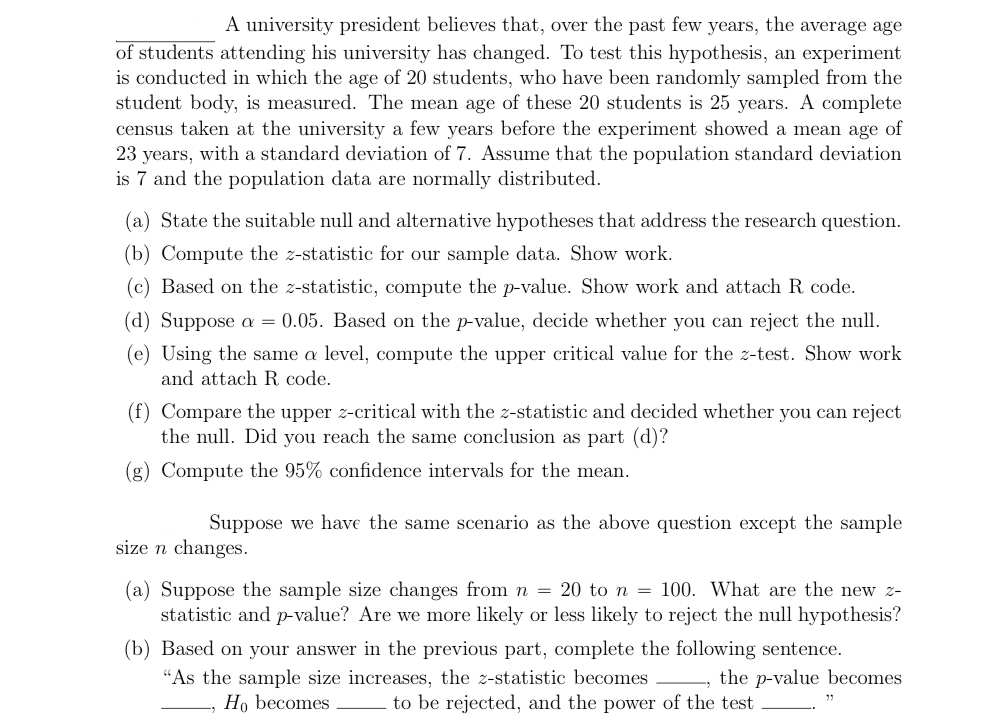

Transcribed Image Text:A university president believes that, over the past few years, the average age
of students attending his university has changed. To test this hypothesis, an experiment
is conducted in which the age of 20 students, who have been randomly sampled from the
student body, is measured. The mean age of these 20 students is 25 years. A complete
census taken at the university a few years before the experiment showed a mean age of
23 years, with a standard deviation of 7. Assume that the population standard deviation
is 7 and the population data are normally distributed.
(a) State the suitable null and alternative hypotheses that address the research question.
(b) Compute the z-statistic for our sample data. Show work.
(c) Based on the z-statistic, compute the p-value. Show work and attach R code.
(d) Suppose a = 0.05. Based on the p-value, decide whether you can reject the null.
(e) Using the same a level, compute the upper critical value for the z-test. Show work
and attach R. code.
(f) Compare the upper z-critical with the z-statistic and decided whether you can reject
the null. Did you reach the same conclusion as part (d)?
(g) Compute the 95% confidence intervals for the mean.
Suppose we have the same scenario as the above question except the sample
size n changes.
(a) Suppose the sample size changes from n = 20 to n = 100. What are the new z-
statistic and p-value? Are we more likely or less likely to reject the null hypothesis?
(b) Based on your answer in the previous part, complete the following sentence.
"As the sample size increases, the z-statistic becomes
Ho becomes
-, the p-value becomes
to be rejected, and the power of the test
33
Expert Solution
This question has been solved!
Explore an expertly crafted, step-by-step solution for a thorough understanding of key concepts.

This is a popular solution

Trending nowThis is a popular solution!

Step by stepSolved in 4 steps with 2 images

Knowledge Booster

Similar questions
- According to the College Board, scores on the math section of the SAT Reasoning college entrance test for the class of 2010 had a mean of 516 and a standard deviation of 116. Assume that they are roughly normal.One of the quartiles of the scores from the math section of the SAT Reasoning test is 438. The other quartile is _______.arrow_forwardA college student is interested in investigating the claim that students who graduate with a master’s degree earn higher salaries, on average, than those who finish with a bachelor’s degree. She surveys, at random, 49 recent graduates who completed their master’s degrees, and finds that their mean salary is $37,400 per year. The standard deviation of annual salaries for the population of recent graduates who have master’s degrees is known to be $2400. She also surveys, at random, 37 recent graduates who completed their bachelor’s degrees, and finds that their mean salary is $36,700 per year. The standard deviation of annual salaries for the population of recent graduates with only bachelor’s degrees is known to be $1900. Test the claim at the 0.05 level of significance. Let recent graduates with a master's degree be Population 1 and let recent graduates with a bachelor's degree be Population 2. Step 2 of 3 : Compute the value of the test statistic. Round your answer to…arrow_forwardA pizza delivery chain advertises that it will deliver your pizza in 35 minutes from when the order is placed. Being a skeptic, you decide to test and see if the mean delivery time is actually more than 35 minutes. For the simple random sample of 14 customers who record the amount of time it takes for each of their pizzas to be delivered, the mean is 37.0 minutes with a standard deviation of 9.9 minutes. Assume that the population distribution is approximately normal. Perform a hypothesis test using a 0.05 level of significance. Step 2 of 3: Compute the value of the test statistic. Round your answer to three decimal places.arrow_forward
- A regional airline serving Las Vegas has a base airfare rate of $99. In addition, various fees are charged: for checked baggage, refreshments/drinks in-flight, and for making a reservation on its website. These additional charges average $70 per passenger. Suppose a random sample of 59 passengers is taken to determine the total cost of their flight. The population standard deviation of total flight cost is known to be $40. (a) What is the population mean cost per flight in dollars? $ (b) What is the probability the sample mean will be within $10 of the population mean cost per flight? (Round your answer to four decimal places.) (c) What is the probability the sample mean will be within $5 of the population mean cost per flight? (Round your answer to four decimal places.)arrow_forwardA hypothesis regarding the weight of newborn infants at a community hospital is that the mean is 7.1 pounds. A sample of seven infants is randomly selected and their weights at birth are recorded as 6.1, 8.1, 9.1, 10.1, 7.1, 11.1, and 12.1 pounds. What is the sample standard deviation?arrow_forwardStudents preparing for comprehensive exams usually spend many hours studying. Suppose it is known that the time students spend studying for comprehensive exams has a distribution that is skewed heavily to the right with a mean of 41.3 hours and a standard deviation of 6.8 hours. If a simple random sample of 72 students is selected and the amount of time each spent studying for the comprehensive exam is determined. State and check the two assumptions.arrow_forward
- A pizza delivery chain advertises that it will deliver your pizza in 35 minutes from when the order is placed. Being a skeptic, you decide to test and see if the mean delivery time is actually more than 35 minutes. For the simple random sample of 14 customers who record the amount of time it takes for each of their pizzas to be delivered, the mean is 37.0 minutes with a standard deviation of 9.9 minutes. Assume that the population distribution is approximately normal. Perform a hypothesis test using a 0.05 level of significance. Step 1 of 3: State the null and alternative hypotheses for the test. Fill in the blank below. Ho: 35 Họ 1 = H₂H = 35arrow_forwardlight examined data on employment and answered questions regarding why workers separate from their employes. According to the article, the standard deviation of the length of time that women with one job are employed during the first 8 years of their career is 92 weeks. Length of time employed during the first 8 years of career is a left skewed variable. For that variable, do the following tasks. A. determine the sampling distribution of the sample mean for simple random samples of 50 women with one job. Explain your reasoning B. Obtain the probability that the sampling error made in estimating the mean length of time employed by all women with one job by that of a random sample of 50 such women will be at most 20 weeksarrow_forwardIn a school district, all sixth grade students take the same standardized test. The superintendant of the school district takes a random sample of 3030 scores from all of the students who took the test. She sees that the mean score is 169169 with a standard deviation of 7.06747.0674. The superintendant wants to know if the standard deviation has changed this year. Previously, the population standard deviation was 1313. Is there evidence that the standard deviation of test scores has decreased at the α=0.005α=0.005 level? Assume the population is normally distributed. Step 1 of 5: State the null and alternative hypotheses. Round to four decimal places when necessary. Step 2 of 5: Determine the critical value(s) of the test statistic. If the test is two-tailed, separate the values with a comma. Round your answer to three decimal places. Step 3 of 5: Determine the value of the test statistic. Round your answer to three decimal places. Step 4 of 5: Make the…arrow_forward
- Insurance Company A claims that its customers pay less for car insurance, on average, than customers of its competitor, Company B. You wonder if this is true, so you decide to compare the average monthly costs of similar insurance policies from the two companies. For a random sample of 1313 people who buy insurance from Company A, the mean cost is $151$151 per month with a standard deviation of $16$16. For 99 randomly selected customers of Company B, you find that they pay a mean of $158$158 per month with a standard deviation of $19$19. Assume that both populations are approximately normal and that the population variances are equal to test Company A’s claim at the 0.050.05 level of significance. Let customers of Company A be Population 1 and let customers of Company B be Population 2. Step 2 of 3: Compute the value of the test statistic. Round your answer to three decimal places.arrow_forwardAccording to Kaiser Family Foundation survey in 2011 and 2010, the average premium for employer-sponsored health insurance for family coverage was $15,073 in 2011 and $13,770 in 2010 (USA TODAY, September 29, 2011). Suppose that these averages were based on random samples of 250 and 200 employees who had such employer-sponsored health insurance plans for 2011 and 2010, respectively. Further assume that the population standard deviations for 2011 and 2010 were $2160 and $1990, respectively.arrow_forwardThe average length of a phone call for cell phone users in the United States is 8.4 minutes, with standard deviation 2.4 minutes. If you were to take a random sample of 40 cell phone users in US, what is the standard deviation of the sampling distribution?arrow_forward
arrow_back_ios
SEE MORE QUESTIONS
arrow_forward_ios
Recommended textbooks for you
- MATLAB: An Introduction with ApplicationsStatisticsISBN:9781119256830Author:Amos GilatPublisher:John Wiley & Sons Inc
 Probability and Statistics for Engineering and th...StatisticsISBN:9781305251809Author:Jay L. DevorePublisher:Cengage Learning
 Statistics for The Behavioral Sciences (MindTap C...StatisticsISBN:9781305504912Author:Frederick J Gravetter, Larry B. WallnauPublisher:Cengage Learning
  Elementary Statistics: Picturing the World (7th E...StatisticsISBN:9780134683416Author:Ron Larson, Betsy FarberPublisher:PEARSON
 The Basic Practice of StatisticsStatisticsISBN:9781319042578Author:David S. Moore, William I. Notz, Michael A. FlignerPublisher:W. H. Freeman
 Introduction to the Practice of StatisticsStatisticsISBN:9781319013387Author:David S. Moore, George P. McCabe, Bruce A. CraigPublisher:W. H. Freeman
MATLAB: An Introduction with Applications
Statistics
ISBN:9781119256830
Author:Amos Gilat
Publisher:John Wiley & Sons Inc
Probability and Statistics for Engineering and th...
Statistics
ISBN:9781305251809
Author:Jay L. Devore
Publisher:Cengage Learning
Statistics for The Behavioral Sciences (MindTap C...
Statistics
ISBN:9781305504912
Author:Frederick J Gravetter, Larry B. Wallnau
Publisher:Cengage Learning
Elementary Statistics: Picturing the World (7th E...
Statistics
ISBN:9780134683416
Author:Ron Larson, Betsy Farber
Publisher:PEARSON
The Basic Practice of Statistics
Statistics
ISBN:9781319042578
Author:David S. Moore, William I. Notz, Michael A. Fligner
Publisher:W. H. Freeman
Introduction to the Practice of Statistics
Statistics
ISBN:9781319013387
Author:David S. Moore, George P. McCabe, Bruce A. Craig
Publisher:W. H. Freeman