MATLAB: An Introduction with Applications
6th Edition
ISBN: 9781119256830
Author: Amos Gilat
Publisher: John Wiley & Sons Inc
expand_more
expand_more
format_list_bulleted
Concept explainers
Topic Video
Question

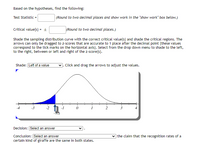
Transcribed Image Text:Based on the hypotheses, find the following:
Test Statistic =
(Round to two decimal places and show work in the "show work" box below.)
Critical value(s) = ±
(Round to two decimal places.)
Shade the sampling distribution curve with the correct critical value(s) and shade the critical regions. The
arrows can only be dragged to z-scores that are accurate to 1 place after the decimal point (these values
correspond to the tick marks on the horizontal axis). Select from the drop down menu to shade to the left,
to the right, between or left and right of the z-score(s).
Shade: Left of a value
7. Click and drag the arrows to adjust the values.
ית
-1.5
-4
-3
0 1
2
3
Decision: Select an answer
v the claim that the recognition rates of a
Conclusion: [Select an answer
certain kind of giraffe are the same in both states.

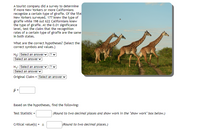
Transcribed Image Text:A tourist company did a survey to determine
if more New Yorkers or more Californians
recognize a certain type of giraffe. Of the 554
New Yorkers surveyed, 177 knew the type of
giraffe while 198 out 622 Californians knew
the type of giraffe. At the 0.01 significance
level, test the claim that the recognition
rates of a certain type of giraffe are the same
in both states.
What are the correct hypotheses? (Select the
correct symbols and values.)
Họ: Select an answer v ? v
Select an answer v
H;: Select an answer
Select an answer v
Original Claim
= Select an answer v
p =
Based on the hypotheses, find the following:
Test Statistic =
(Round to two decimal places and show work in the "show work" box below.)
Critical value(s) = ±
(Round to two decimal places.)
%3D
Expert Solution
This question has been solved!
Explore an expertly crafted, step-by-step solution for a thorough understanding of key concepts.
Step by stepSolved in 2 steps with 1 images

Knowledge Booster
Learn more about
Need a deep-dive on the concept behind this application? Look no further. Learn more about this topic, statistics and related others by exploring similar questions and additional content below.Similar questions
- A company that produces a particular brand of juice knows that about 30% of people select that brand if given a choice of all brands. To determine if a commercial would be an effective advertising tool, the company invites 100 people to view a 30-minute program that includes a commercial for the company’s juice. After the program, the participants are offered a choice of juice brands. In this trial, 36 of the 100 participants chose the company’s juice. When a significance test was performed to determine if the true proportion of people who watch the commercial and select the company’s juice exceeds 30%, the P-value was 0.0952. At the α = 0.05 significance level, what decision should the company make? A. Because the P-value of 0.0952 > α = 0.05, the company has evidence that the true proportion of those who would select the company’s juice is larger than 30%. B. Because the P-value of 0.0952 < 0.3, the company has evidence that the true proportion of those who would select the…arrow_forwardA tourist company did a survey to determine if more New Yorkers or more Californians recognize a certain type of giraffe. Of the 583 New Yorkers surveyed, 198 knew the type of giraffe while 188 out 641 Californians knew the type of giraffe. At the 0.1 significance level, test the claim that the recognition rates of a certain type of giraffe are the same in both states. What are the correct hypotheses? (Select the correct symbols and values.)arrow_forwardSuppose that in a random selection of 100 colored candies, 21% of them are blue. The candy company claims that the percentage of blue candies is equal to 25%. Use a 0.01 significance level to test that claim.The test statistic for this hypothesis test isarrow_forward
- An online poll asked: "Do you believe the Loch Ness monster exists?" Among 21,523 responses, 61% were "yes." Use a 0.01 significance level to test the claim that most people believe that the Loch Ness monster exists. How is the conclusion affected by the fact that Internet users who saw the question could decide whether to respond?arrow_forwardA study was conducted to determine the proportion of people who dream in black and white instead of color. Among 294 people over the age of 55, 78 dream in black and white, and among 291 people under the age of 25, 10 dream in black and white. Use a 0.01 significance level to test the claim that the proportion of people over 55 who dream in black and white is greater than the proportion for those under 25. Complete parts (a) through (c) below indentify test statistic p value= the 90% confidence interval isarrow_forwardChristine, a researcher in psychology and biobehavioral health, believes that city residents and residents of rural areas differ in how appealing they find owning a cat. A random sample of 109 people who live in San Antonio were surveyed and 59 identified themselves as a "cat person." A random sample of 108 people who live in the surrounding rural area were selected and 72 identified themselves as a "cat person." Conduct an appropriate hypothesis test at the a = 0.1 significance level to test Christine's claim. Round answers to 4 decimal places where appropriate. a. State the null and alternative hypotheses. Ho: p. H₁: p. b. What is the appropriate distribution to use for the hypothesis test? Z (Normal) c. Find the test statistic. Test Statistic: -1.9593 X d. Determine the P-value: op. P-value: 0.0501 X O p.arrow_forward
- A study was conducted to determine the proportion of people who dream in black and white instead of color. Among 285 people over the age of 55, 76 dream in black and white, and among 287 people under the age of 25, 10 dream in black and white. Use a 0.01 significance level to test the claim that the proportion of people over 55 who dream in black and white is greater than the proportion for those under 25. Test the claim using a hypothesis test. Consider the first sample to be the sample of people over the age of 55 and the second sample to be the sample of people under the age of 25. What are the null and alternative hypotheses for the hypothesis test? O A. Ho: P1 = P2 H: P1> P2 O B. Ho: P1 = P2 OC. Ho: P1 = P2 H: P Persuasive Spe.docx a Persuasive Spee.doc a PersuasiveSpch.doc tv MacBook Air F10 F9 心. 20 F3 FS esc F1 F2 & $ % 8 9 @ 4 5 6 2 Y W E R K #3arrow_forwardThe table below includes results from polygraph (lie detector) experiments conducted by researchers. In each case, it was known if the subjected lied or did not lie, so the table indicates when the polygraph test was correct. Use a 0.05 significance level to test the claim that whether a subject lies is independent of the polygraph test indication. Do the results suggest that polygraphs are effective in distinguishing between truth and lies? LOADING... Click the icon to view the table. Determine the null and alternative hypotheses. A. H0: Polygraph testing is accurate. H1: Polygraph testing is not accurate. B. H0: Polygraph testing is not accurate. H1: Polygraph testing is accurate. C. H0: Whether a subject lies is independent of the polygraph test indication. H1: Whether a subject lies is not independent of the polygraph test indication. Your answer is correct. D. H0: Whether a subject lies is not independent of the polygraph…arrow_forwardPast studies have indicated that the percentage of smokers was estimated to be about 34%. Given the new smoking cessation programs that have been implemented, you now believe that the percentage of smokers has reduced. You randomly surveyed 1807 people and found that 574 smoke. Use a 0.05 significance level to test the claim that the percentage of smokers has reduced. a) Identify the null and alternative hypotheses? Но: ? H1: ? v b) What type of hypothesis test should you conduct (left-, right-, or two-tailed)? O left-tailed O right-tailed O two-tailed c) Identify the appropriate significance level. d) Calculate your test statistic. Write the result below, and be sure to round your final answer to two decimal places. e) Calculate your p-value. Write the result below, and be sure to round your final answer to four decimal places. f) Do you reject the null hypothesis? O We reject the null hypothesis, since the p-value is less than the significance level. O We reject the null hypothesis,…arrow_forward
arrow_back_ios
arrow_forward_ios
Recommended textbooks for you
 MATLAB: An Introduction with ApplicationsStatisticsISBN:9781119256830Author:Amos GilatPublisher:John Wiley & Sons Inc
 Probability and Statistics for Engineering and th...StatisticsISBN:9781305251809Author:Jay L. DevorePublisher:Cengage Learning
 Statistics for The Behavioral Sciences (MindTap C...StatisticsISBN:9781305504912Author:Frederick J Gravetter, Larry B. WallnauPublisher:Cengage Learning
 Elementary Statistics: Picturing the World (7th E...StatisticsISBN:9780134683416Author:Ron Larson, Betsy FarberPublisher:PEARSON
 The Basic Practice of StatisticsStatisticsISBN:9781319042578Author:David S. Moore, William I. Notz, Michael A. FlignerPublisher:W. H. Freeman
 Introduction to the Practice of StatisticsStatisticsISBN:9781319013387Author:David S. Moore, George P. McCabe, Bruce A. CraigPublisher:W. H. Freeman

MATLAB: An Introduction with Applications
Statistics
ISBN:9781119256830
Author:Amos Gilat
Publisher:John Wiley & Sons Inc

Probability and Statistics for Engineering and th...
Statistics
ISBN:9781305251809
Author:Jay L. Devore
Publisher:Cengage Learning

Statistics for The Behavioral Sciences (MindTap C...
Statistics
ISBN:9781305504912
Author:Frederick J Gravetter, Larry B. Wallnau
Publisher:Cengage Learning

Elementary Statistics: Picturing the World (7th E...
Statistics
ISBN:9780134683416
Author:Ron Larson, Betsy Farber
Publisher:PEARSON

The Basic Practice of Statistics
Statistics
ISBN:9781319042578
Author:David S. Moore, William I. Notz, Michael A. Fligner
Publisher:W. H. Freeman

Introduction to the Practice of Statistics
Statistics
ISBN:9781319013387
Author:David S. Moore, George P. McCabe, Bruce A. Craig
Publisher:W. H. Freeman