
MATLAB: An Introduction with Applications
6th Edition
ISBN: 9781119256830
Author: Amos Gilat
Publisher: John Wiley & Sons Inc
expand_more
expand_more
format_list_bulleted
Related questions
Topic Video
Question
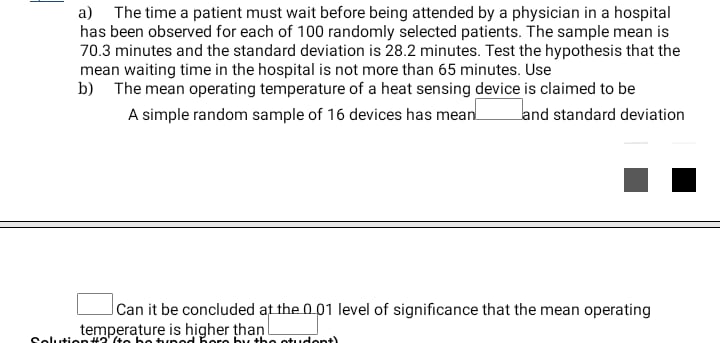

Transcribed Image Text:a) The time a patient must wait before being attended by a physician in a hospital
has been observed for each of 100 randomly selected patients. The sample mean is
70.3 minutes and the standard deviation is 28.2 minutes. Test the hypothesis that the
mean waiting time in the hospital is not more than 65 minutes. Use
b) The mean operating temperature of a heat sensing device is claimed to be
A simple random sample of 16 devices has mean.
land standard deviation
Can it be concluded at the 001 level of significance that the mean operating
temperature is higher than
Selution#2' (te be tur ed Bore by the otudont)
Expert Solution
This question has been solved!
Explore an expertly crafted, step-by-step solution for a thorough understanding of key concepts.

Step by stepSolved in 2 steps with 1 images

Knowledge Booster


Learn more about
Need a deep-dive on the concept behind this application? Look no further. Learn more about this topic, statistics and related others by exploring similar questions and additional content below.Similar questions
- According to a news program, Americans take an average of 4.9 days off per year because of illness. The manager of a large chain of grocery stores wants to know if the employees at the grocery store, on average, take fewer days off than the national average. The manager selects a random sample of 80 employees in the company and found the sample mean number of days off for the 80 employees was 4.75 days with a standard deviation of 0.9 days. When the manager performed a significance test, the P-value was 0.07. What is the meaning of this P-value in context?arrow_forwardThe distribution for the time a patient of a medical center spends waiting for an appointment is normal with mean of 35 minutes and standard deviation of 12 minutes. What proportion of patients will wait more than 47 minutes for an appointment?arrow_forwardDiscribe the scores in a sample that has a standard deviation of zero.arrow_forward
- What is the equation for The standard deviation of the distribution of sample meansarrow_forwardA researcher believes the mean weight of males sulcata tortoises is more than 205 pounds. She samples 18 males sulcatas and find their mean to be 216.2 pounds with a standard deviation of 13.5pounds. Find the p-value p =arrow_forwardThe admission committee of AUCA passes 33% of those who took the exam. If the scores follow a normal distribution with a mean of 85 and a standard deviation of 9, what is the passing score?arrow_forward
- The honors program at Brad's university only accepts students with an entrance exam score over 400. What percentage of students would be eligible if the students at Brad's school have an average exam score of 250, with a standard deviation of 80?arrow_forwardA nutritionist wants to determine how much time nationally people spend eating and drinking. Suppose a random sample of 1077 people with mean amount of time spent eating and drinking per day is 1.09 hours with standard deviation of 0.52 hours, 95 percent confident ratearrow_forwardA random sample of 18 light bulbs is drawn from a normally distributed population. The population has mean and standard deviation are 517 hours and 39 hours, respectively. What is the mean of the sampling distribution the sample mean?arrow_forward
- The daily number of bad checks received by a large department store in a random sample of 5 days out of the past year was 67, 76, 72, 84, and 76. Find the Standard deviation.arrow_forwardThe results of a common standardized test used in psychology research is designed so that the population mean is 100 and the standard deviation is 40. A subject earns a score of 192. What is the Z-score for this raw score? Z-Score =arrow_forward
arrow_back_ios
arrow_forward_ios
Recommended textbooks for you
- MATLAB: An Introduction with ApplicationsStatisticsISBN:9781119256830Author:Amos GilatPublisher:John Wiley & Sons Inc
 Probability and Statistics for Engineering and th...StatisticsISBN:9781305251809Author:Jay L. DevorePublisher:Cengage Learning
 Statistics for The Behavioral Sciences (MindTap C...StatisticsISBN:9781305504912Author:Frederick J Gravetter, Larry B. WallnauPublisher:Cengage Learning
  Elementary Statistics: Picturing the World (7th E...StatisticsISBN:9780134683416Author:Ron Larson, Betsy FarberPublisher:PEARSON
 The Basic Practice of StatisticsStatisticsISBN:9781319042578Author:David S. Moore, William I. Notz, Michael A. FlignerPublisher:W. H. Freeman
 Introduction to the Practice of StatisticsStatisticsISBN:9781319013387Author:David S. Moore, George P. McCabe, Bruce A. CraigPublisher:W. H. Freeman
MATLAB: An Introduction with Applications
Statistics
ISBN:9781119256830
Author:Amos Gilat
Publisher:John Wiley & Sons Inc
Probability and Statistics for Engineering and th...
Statistics
ISBN:9781305251809
Author:Jay L. Devore
Publisher:Cengage Learning
Statistics for The Behavioral Sciences (MindTap C...
Statistics
ISBN:9781305504912
Author:Frederick J Gravetter, Larry B. Wallnau
Publisher:Cengage Learning
Elementary Statistics: Picturing the World (7th E...
Statistics
ISBN:9780134683416
Author:Ron Larson, Betsy Farber
Publisher:PEARSON
The Basic Practice of Statistics
Statistics
ISBN:9781319042578
Author:David S. Moore, William I. Notz, Michael A. Fligner
Publisher:W. H. Freeman
Introduction to the Practice of Statistics
Statistics
ISBN:9781319013387
Author:David S. Moore, George P. McCabe, Bruce A. Craig
Publisher:W. H. Freeman