
MATLAB: An Introduction with Applications
6th Edition
ISBN: 9781119256830
Author: Amos Gilat
Publisher: John Wiley & Sons Inc
expand_more
expand_more
format_list_bulleted
Related questions
Question
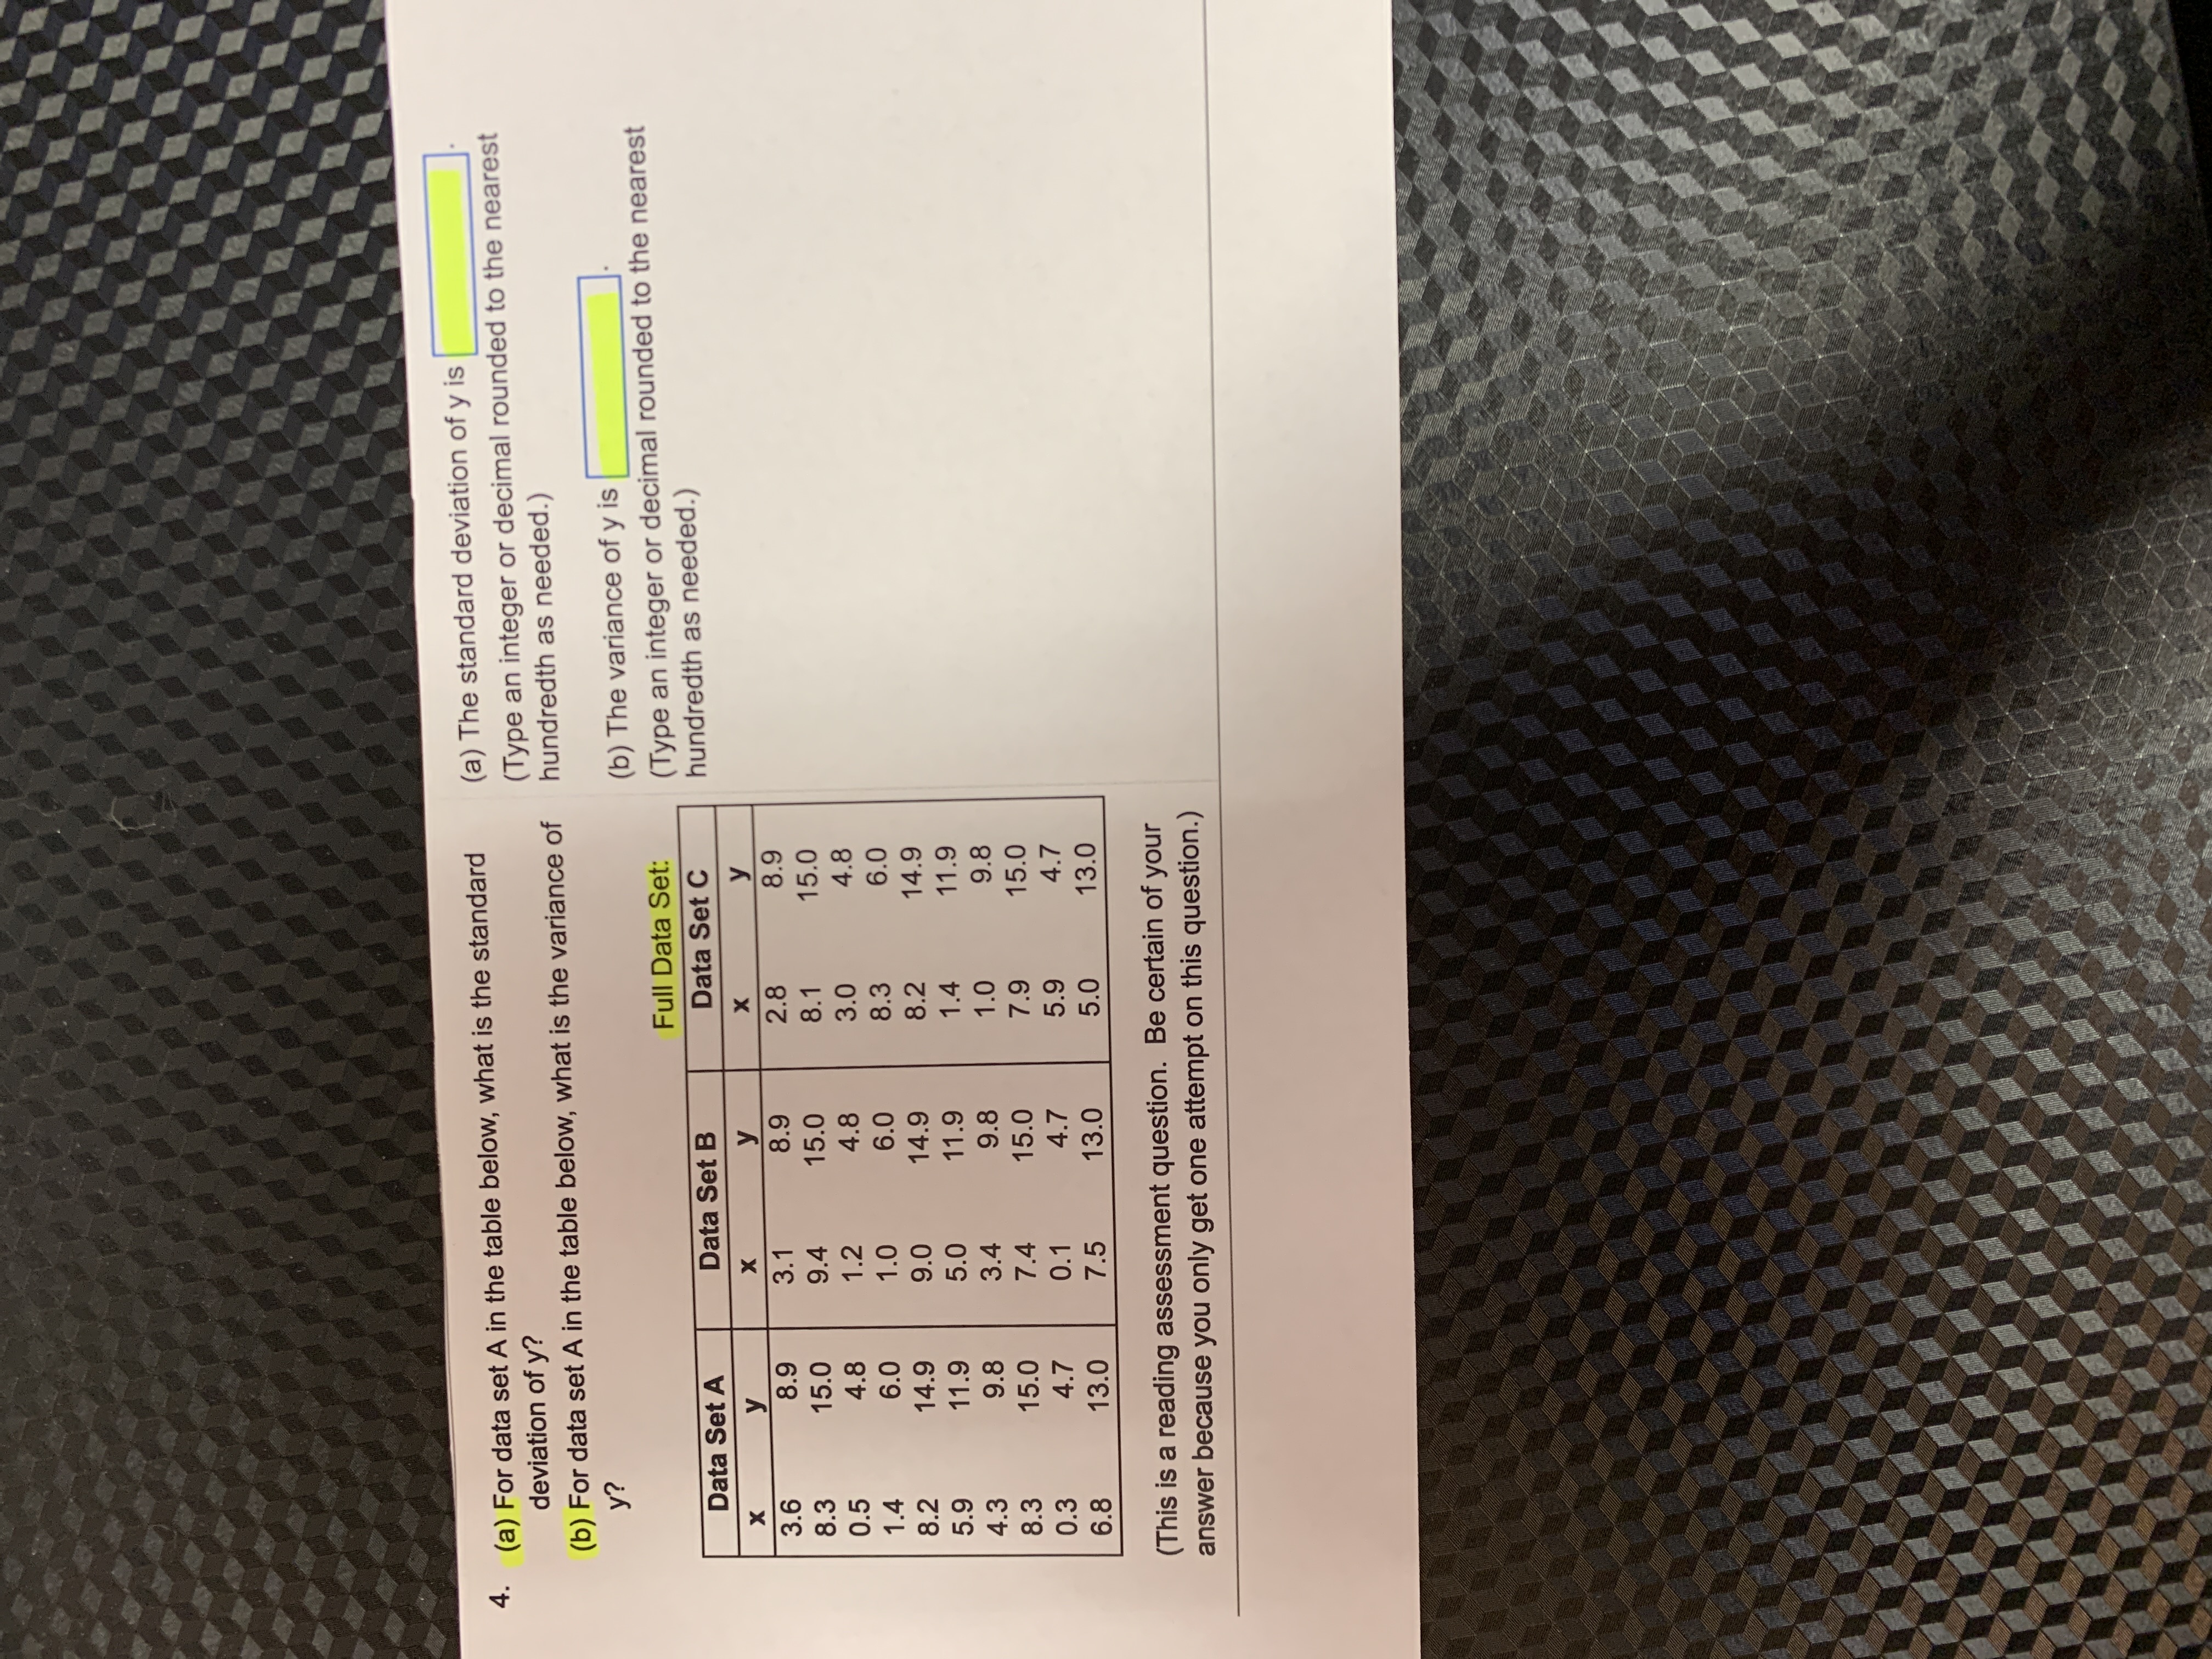

Transcribed Image Text:(a) The standard deviation of y is
4. (a) For data set A in the table below, what is the standard
(Type an integer or decimal rounded to the nearest
hundredth as needed.)
deviation of y?
(b) For data set A in the table below, what is the variance of
y?
(b) The variance of y is
(Type an integer or decimal rounded to the nearest
hundredth as needed.)
Full Data Set:
Data Set A
Data Set B
Data Set C
y
3.6
3.1
2.8
8.3
15.0
9.4
15.0
8.1
15.0
0.5
4.8
1.2
4.8
3.0
4.8
1.4
6.0
1.0
6.0
8.3
6.0
8.2
14.9
14.9
8.2 14.9
11.9
5.0
11.9
1.4
11.9
4.3
9.8
3.4
9.8
9.8
8.3
15.0
7.4
15.0
15.0
0.3
4.7
0.1
4.7
4.7
6.8
13.0
7.5
13.0
5.0
13.0
(This is a reading assessment question. Be certain of your
answer because you only get one attempt on this question.)
Expert Solution
This question has been solved!
Explore an expertly crafted, step-by-step solution for a thorough understanding of key concepts.

This is a popular solution

Trending nowThis is a popular solution!

Step by stepSolved in 2 steps with 2 images

Knowledge Booster

Similar questions
- Use the formula to find the standard error of the distribution of differences in sample means, I1 – X2. Samples of size 110 from Population 1 with mean 82 and standard deviation 14 and samples of size 80 from Population 2 with mean 76 and standard deviation 17 Round your answer for the standard error to two decimal places. standard error = iarrow_forwardA queueing system has an arrival rate of 37 visitors per day (standard deviation of 32) and a service rate of 42 visitors per day (standard deviation of 25). (Round your answer to three decimal places.) What is the coefficient of variation of the arrival rate?arrow_forwardsuppose the mean is 8 and 1/3 and the population variance is 6 and 8/9 and a>9 x 5 9 a frequency 3 f 2 a=? f=?arrow_forward
- ou should complete the table as part of the procedure of finding the variance and standard deviation. Xi (Xi-(mu)) | (Xi-(mu)) | 49 53 60 60 62 63 64 69 73 87 [Note, this is the same set of data points used in problem 6. How does this compare to the standard deviation computed in problem 6? Why might this be smaller?]arrow_forwardOur environment is very sensitive to the amount of ozone in the upper atmosphere. The level of ozone normally found is 7.9 parts/million (ppm). A researcher believes that the current ozone level is at an excess level. The mean of 24 samples is 8.1 ppm with a variance of 0.25. Does the data support the claim at the 0.1 level? Assume the population distribution is approximately normal. Step 5 of 5: Make the decision to reject or fail to reject the null hypothesis.arrow_forwardA chi square test tells us: a. Whether two continuous variables are correlated with each other. b. Whether two discrete variables are independent of each other c. The amount of variation in one variable explained by the other d. Which categories of one variable are associated with which categories of the other variablearrow_forward
arrow_back_ios
arrow_forward_ios
Recommended textbooks for you
- MATLAB: An Introduction with ApplicationsStatisticsISBN:9781119256830Author:Amos GilatPublisher:John Wiley & Sons Inc
 Probability and Statistics for Engineering and th...StatisticsISBN:9781305251809Author:Jay L. DevorePublisher:Cengage Learning
 Statistics for The Behavioral Sciences (MindTap C...StatisticsISBN:9781305504912Author:Frederick J Gravetter, Larry B. WallnauPublisher:Cengage Learning
  Elementary Statistics: Picturing the World (7th E...StatisticsISBN:9780134683416Author:Ron Larson, Betsy FarberPublisher:PEARSON
 The Basic Practice of StatisticsStatisticsISBN:9781319042578Author:David S. Moore, William I. Notz, Michael A. FlignerPublisher:W. H. Freeman
 Introduction to the Practice of StatisticsStatisticsISBN:9781319013387Author:David S. Moore, George P. McCabe, Bruce A. CraigPublisher:W. H. Freeman
MATLAB: An Introduction with Applications
Statistics
ISBN:9781119256830
Author:Amos Gilat
Publisher:John Wiley & Sons Inc
Probability and Statistics for Engineering and th...
Statistics
ISBN:9781305251809
Author:Jay L. Devore
Publisher:Cengage Learning
Statistics for The Behavioral Sciences (MindTap C...
Statistics
ISBN:9781305504912
Author:Frederick J Gravetter, Larry B. Wallnau
Publisher:Cengage Learning
Elementary Statistics: Picturing the World (7th E...
Statistics
ISBN:9780134683416
Author:Ron Larson, Betsy Farber
Publisher:PEARSON
The Basic Practice of Statistics
Statistics
ISBN:9781319042578
Author:David S. Moore, William I. Notz, Michael A. Fligner
Publisher:W. H. Freeman
Introduction to the Practice of Statistics
Statistics
ISBN:9781319013387
Author:David S. Moore, George P. McCabe, Bruce A. Craig
Publisher:W. H. Freeman