
MATLAB: An Introduction with Applications
6th Edition
ISBN: 9781119256830
Author: Amos Gilat
Publisher: John Wiley & Sons Inc
expand_more
expand_more
format_list_bulleted
Related questions
Question
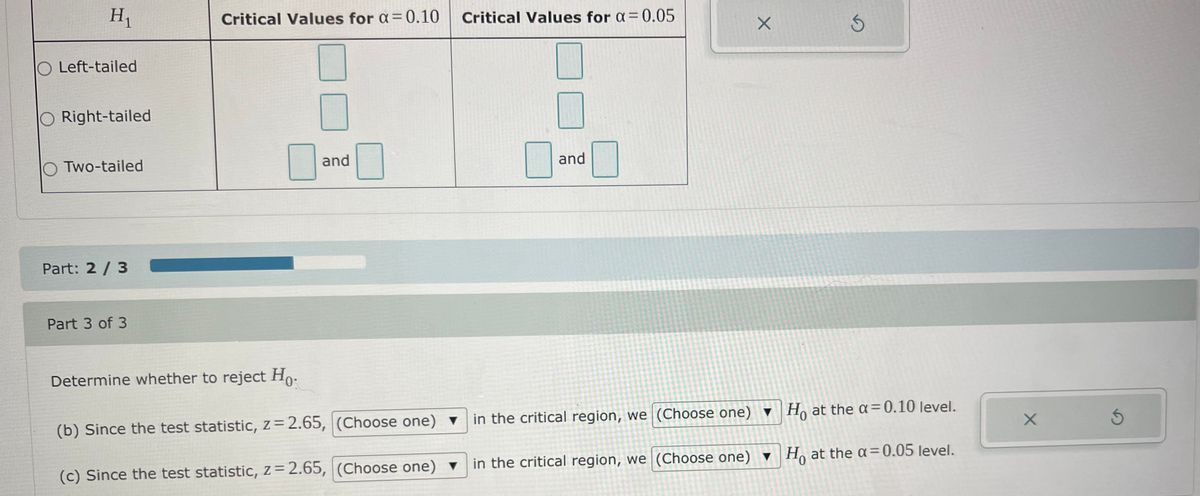

Transcribed Image Text:H1
Critical Values for a=0.10
Critical Values for a= 0.05
O Left-tailed
Right-tailed
and
and
O Two-tailed
Part: 2 / 3
Part 3 of 3
Determine whether to reject Ho:
(b) Since the test statistic, z= 2.65, (Choose one) v in the critical region, we (Choose one) ▼ H, at the a=0.10 level.
(c) Since the test statistic, z= 2.65, (Choose one) v in the critical region, we (Choose one) ▼ H, at the a=0.05 level.

Transcribed Image Text:A test is made of Ho: H= 17 versus H,: µ# 17. A sample of size n= 50 is drawn, and x =20. The population standard deviation is o=8.
0,
(a) Compute the value of the test statistic z.
(b) Is Ho rejected at the a= 0.10 level?
(c) Is Ho rejected at the a=0.05 level?
Part: 0/ 3
Part 1 of 3
(a) Compute the value of the test statistic. Round the answer to at least two decimal places.
11
Expert Solution
This question has been solved!
Explore an expertly crafted, step-by-step solution for a thorough understanding of key concepts.

This is a popular solution

Trending nowThis is a popular solution!

Step by stepSolved in 4 steps

Knowledge Booster

Similar questions
- Suppose the mean IQ score of people in a certain country is 100. Suppose the director of a college obtains a simple random sample of 39 students from that country and finds the mean IQ is 104.5 with a standard deviation of 13.6. Complete parts (a) through (d) below. (a) Consider the hypotheses Ho: µ= 100 versus H,: µ> 100. Explain what the director is testing. Perform the test at the a = 0.10 level of significance. Write a conclusion for the test. Explain what the director is testing. Choose the correct answer below. O A. The director is testing if the sample provided sufficient evidence that the population mean IQ score is actually not equal to 100. OB. The director is testing if the sample provided sufficient evidence that the population mean IQ score is actually greater than 100. O C. The director is testing if the sample provided sufficient evidence that the population mean IQ score is actually not greater than 100. O D. The director is testing if the sample provided sufficient…arrow_forwardwhat is the value of (M-m)?arrow_forwardA series of measurements in the lab led to an experimental result of 32.9 mL, with a calculated standard deviation of 0.3 mL. What is the standard way to report this result? Select one: 32.6-33.2 mL 32.9 ± 0.3 mL 32.9 ± 0.30 mL = 32.9 mLarrow_forward
- Suppose the mean IQ score of people in a certain country is 103. Suppose the director of a college obtains a simple random sample of 37 students from that country and finds the mean IQ is 107.4 with a standard deviation of 13.8. Complete parts (a) through (d) below. (a) Consider the hypotheses Ho: H= 103 versus H: u> 103. Explain what the director is testing. Perform the test at the a = 0.01 level of significance. Write a conclusion for the test. Explain what the director is testing. Choose the correct answer below. A. The director is testing if the sample provided sufficient evidence that the population mean IQ score is actually greater than 103. B. The director is testing if the sample provided sufficient evidence that the population mean IQ score is actually not equal to 103. O C. The director is testing if the sample provided sufficient evidence that the population mean IQ score is actually equal to 103. O D. The director is testing if the sample provided sufficient evidence that…arrow_forwardH0:μ=41.92H0:μ=41.92H1:μ≠41.92H1:μ≠41.92Your sample consists of 43 subjects, with a mean of 42 and standard deviation of 1.56.Calculate the test statistic, rounded to 2 decimal places. t=arrow_forward
arrow_back_ios
arrow_forward_ios
Recommended textbooks for you
- MATLAB: An Introduction with ApplicationsStatisticsISBN:9781119256830Author:Amos GilatPublisher:John Wiley & Sons Inc
 Probability and Statistics for Engineering and th...StatisticsISBN:9781305251809Author:Jay L. DevorePublisher:Cengage Learning
 Statistics for The Behavioral Sciences (MindTap C...StatisticsISBN:9781305504912Author:Frederick J Gravetter, Larry B. WallnauPublisher:Cengage Learning
  Elementary Statistics: Picturing the World (7th E...StatisticsISBN:9780134683416Author:Ron Larson, Betsy FarberPublisher:PEARSON
 The Basic Practice of StatisticsStatisticsISBN:9781319042578Author:David S. Moore, William I. Notz, Michael A. FlignerPublisher:W. H. Freeman
 Introduction to the Practice of StatisticsStatisticsISBN:9781319013387Author:David S. Moore, George P. McCabe, Bruce A. CraigPublisher:W. H. Freeman
MATLAB: An Introduction with Applications
Statistics
ISBN:9781119256830
Author:Amos Gilat
Publisher:John Wiley & Sons Inc
Probability and Statistics for Engineering and th...
Statistics
ISBN:9781305251809
Author:Jay L. Devore
Publisher:Cengage Learning
Statistics for The Behavioral Sciences (MindTap C...
Statistics
ISBN:9781305504912
Author:Frederick J Gravetter, Larry B. Wallnau
Publisher:Cengage Learning
Elementary Statistics: Picturing the World (7th E...
Statistics
ISBN:9780134683416
Author:Ron Larson, Betsy Farber
Publisher:PEARSON
The Basic Practice of Statistics
Statistics
ISBN:9781319042578
Author:David S. Moore, William I. Notz, Michael A. Fligner
Publisher:W. H. Freeman
Introduction to the Practice of Statistics
Statistics
ISBN:9781319013387
Author:David S. Moore, George P. McCabe, Bruce A. Craig
Publisher:W. H. Freeman