
MATLAB: An Introduction with Applications
6th Edition
ISBN: 9781119256830
Author: Amos Gilat
Publisher: John Wiley & Sons Inc
expand_more
expand_more
format_list_bulleted
Related questions
Question
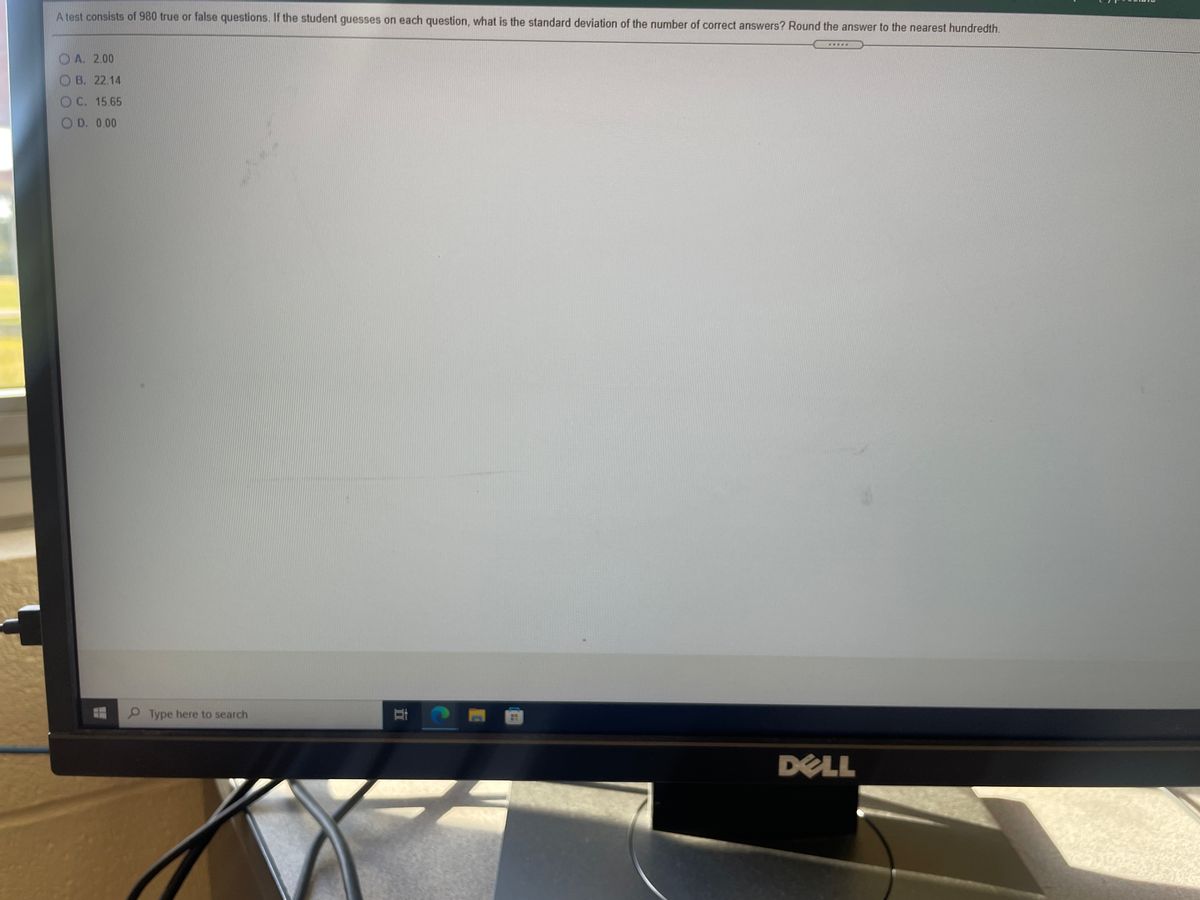

Transcribed Image Text:A test consists of 980 true or false questions. If the student guesses on each question, what is the standard deviation of the number of correct answers? Round the answer to the nearest hundredth.
O A. 2.00
O B. 22.14
OC. 15.65
O D. 0.00
Type here to search
DELL
Expert Solution
This question has been solved!
Explore an expertly crafted, step-by-step solution for a thorough understanding of key concepts.

This is a popular solution

Trending nowThis is a popular solution!

Step by stepSolved in 2 steps with 1 images

Knowledge Booster

Similar questions
- Using the short cut formula we learned in class, find the standard deviation of the following list of numbers. 8, 8, 8, 2, 2, 2, 2, 2, 2 Choose the answer that is closest. a. 3.0 b. 3.2 c. 3.4 d. 2.8arrow_forwardwhat is the mean when pi= 0.25 and n=40?arrow_forwardSave Suppose a random sample of n = 390 teenagers 13 to 17 years of age was asked if they use social media. Of those surveyed, 276 stated that they do use social media. Find the sample proportion of teenagers 13 to 17 years of age who use social media. The sample proportion is p= (Round to three decimal places as needed.)arrow_forward
- Round every calculation to 2 decimal points unless the specific question asks for something different. Show answers as decimals and not percents or fractions.arrow_forwardFind the area of the shaded region. The graph to the right depicts IQ scores of adults, and those scores are normally distributed with a mean of 100 and a standard deviation of 15. Click to view page 1 of the table. Click to view page 2 of the table. 70 105 The area of the shaded region is (Round to four decimal places as needed.)arrow_forwardFind the area of the shaded region. The graph to the right depicts IQ scores of adults, and those scores are normally distributed with a mean of 100 and a standard deviation of 15. Click to view page 1 of the table. Click to view page 2 of the table. The area of the shaded region is (Round to four decimal places as needed.) 70 125 Qarrow_forward
- Assume that the readings on the thermometers are normally distributed with a mean of 0° and standard deviation of 1.00°C. A thermometer is randomly selected and tested. Draw a sketch and find the temperature reading corresponding to P34, the 84th percentile. This is the temperature reading separating the bottom 84% from the top 16%. Click to view page 1 of the table. Click to view page 2 of the table. Which graph represents P ? Choose the correct graph below. 84 A. В. OC. D. Ay X The temperature for P84 is approximately (Round to two decimal places as needed.)arrow_forwardThe distances golf balls travel under laboratory testing conditions are normally distributed. The mean is 312 yards. The probability the golf ball travels further than 319 yards is 0.28. Find the probability a randomly selected golf ball travels between 305 yards and 319 yards. Express the answer as a decimal value rounded to the nearest hundredth.arrow_forward
arrow_back_ios
arrow_forward_ios
Recommended textbooks for you
- MATLAB: An Introduction with ApplicationsStatisticsISBN:9781119256830Author:Amos GilatPublisher:John Wiley & Sons Inc
 Probability and Statistics for Engineering and th...StatisticsISBN:9781305251809Author:Jay L. DevorePublisher:Cengage Learning
 Statistics for The Behavioral Sciences (MindTap C...StatisticsISBN:9781305504912Author:Frederick J Gravetter, Larry B. WallnauPublisher:Cengage Learning
  Elementary Statistics: Picturing the World (7th E...StatisticsISBN:9780134683416Author:Ron Larson, Betsy FarberPublisher:PEARSON
 The Basic Practice of StatisticsStatisticsISBN:9781319042578Author:David S. Moore, William I. Notz, Michael A. FlignerPublisher:W. H. Freeman
 Introduction to the Practice of StatisticsStatisticsISBN:9781319013387Author:David S. Moore, George P. McCabe, Bruce A. CraigPublisher:W. H. Freeman
MATLAB: An Introduction with Applications
Statistics
ISBN:9781119256830
Author:Amos Gilat
Publisher:John Wiley & Sons Inc
Probability and Statistics for Engineering and th...
Statistics
ISBN:9781305251809
Author:Jay L. Devore
Publisher:Cengage Learning
Statistics for The Behavioral Sciences (MindTap C...
Statistics
ISBN:9781305504912
Author:Frederick J Gravetter, Larry B. Wallnau
Publisher:Cengage Learning
Elementary Statistics: Picturing the World (7th E...
Statistics
ISBN:9780134683416
Author:Ron Larson, Betsy Farber
Publisher:PEARSON
The Basic Practice of Statistics
Statistics
ISBN:9781319042578
Author:David S. Moore, William I. Notz, Michael A. Fligner
Publisher:W. H. Freeman
Introduction to the Practice of Statistics
Statistics
ISBN:9781319013387
Author:David S. Moore, George P. McCabe, Bruce A. Craig
Publisher:W. H. Freeman