MATLAB: An Introduction with Applications
6th Edition
ISBN: 9781119256830
Author: Amos Gilat
Publisher: John Wiley & Sons Inc
expand_more
expand_more
format_list_bulleted
Question
Please help me with the following question

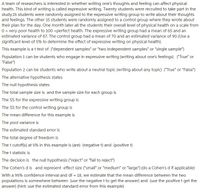
Transcribed Image Text:A team of researchers is interested in whether writing one's thoughts and feeling can affect physical
health. This kind of writing is called expressive writing. Twenty students were recruited to take part in the
study.15 students were randomly assigned to the expressive writing group to write about their thoughts
and feelings. The other 15 students were randomly assigned to a control group where they wrote about
their plan for the day. One month later all the students their overall level of physical health on a scale from
0 = very poor health to 100 =perfect health. The expressive writing group had a mean of 65 and an
estimated variance of 87. The control group had a mean of 70 and an estimated variance of 90 (Use a
significant level of 5% to determine the effect of expressive writing on physical health).
This example is a t test of ("dependent samples" or "two independent samples" or "single sample")
Population 1 can be students who engage in expressive writing (writing about one's feelings) ("True" or
"False")
Population 2 can be students who write about a neutral topic (writing about any topic) ("True" or "False")
The alternative hypothesis states
The null hypothesis states
The total sample size is and the sample size for each group is
The SS for the expressive writing group is
The SS for the control writing group is
The mean difference for this example is
The pool variance is
The estimated standard error is
The total degree of freedom is
The t cutoff(s) at 5% in this example is (are) (negative t) and (positive t)
The t statistic is
The decision is the null hypothesis ("reject" or "fail to reject")
The Cohen's d is and represent effect size ("small" or "medium" or "large") (do a Cohen's d if applicable)
With a 95% confidence interval and df = 18, we estimate that the mean difference between the two
populations is somewhere between (use the negative t to get the answer) and (use the positive t get the
answer) (hint: use the estimated standard error from this example)
Expert Solution
This question has been solved!
Explore an expertly crafted, step-by-step solution for a thorough understanding of key concepts.
Step by stepSolved in 2 steps

Knowledge Booster
Similar questions
arrow_back_ios
arrow_forward_ios
Recommended textbooks for you
 MATLAB: An Introduction with ApplicationsStatisticsISBN:9781119256830Author:Amos GilatPublisher:John Wiley & Sons Inc
 Probability and Statistics for Engineering and th...StatisticsISBN:9781305251809Author:Jay L. DevorePublisher:Cengage Learning
 Statistics for The Behavioral Sciences (MindTap C...StatisticsISBN:9781305504912Author:Frederick J Gravetter, Larry B. WallnauPublisher:Cengage Learning
 Elementary Statistics: Picturing the World (7th E...StatisticsISBN:9780134683416Author:Ron Larson, Betsy FarberPublisher:PEARSON
 The Basic Practice of StatisticsStatisticsISBN:9781319042578Author:David S. Moore, William I. Notz, Michael A. FlignerPublisher:W. H. Freeman
 Introduction to the Practice of StatisticsStatisticsISBN:9781319013387Author:David S. Moore, George P. McCabe, Bruce A. CraigPublisher:W. H. Freeman

MATLAB: An Introduction with Applications
Statistics
ISBN:9781119256830
Author:Amos Gilat
Publisher:John Wiley & Sons Inc

Probability and Statistics for Engineering and th...
Statistics
ISBN:9781305251809
Author:Jay L. Devore
Publisher:Cengage Learning

Statistics for The Behavioral Sciences (MindTap C...
Statistics
ISBN:9781305504912
Author:Frederick J Gravetter, Larry B. Wallnau
Publisher:Cengage Learning

Elementary Statistics: Picturing the World (7th E...
Statistics
ISBN:9780134683416
Author:Ron Larson, Betsy Farber
Publisher:PEARSON

The Basic Practice of Statistics
Statistics
ISBN:9781319042578
Author:David S. Moore, William I. Notz, Michael A. Fligner
Publisher:W. H. Freeman

Introduction to the Practice of Statistics
Statistics
ISBN:9781319013387
Author:David S. Moore, George P. McCabe, Bruce A. Craig
Publisher:W. H. Freeman