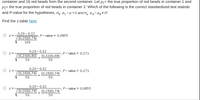
A teacher has two large containers filled with blue, red, and green beads, and claims the proportion of red beads is the same for both containers. The students believe the proportions are different. Each student shakes the first container, selects 50 beads, counts the number of red beads, and returns the beads to the container. The student repeats this process for the second container. One student’s samples contained 10 red beads from the first container and 16 red beads from the second container. Let p1= the true proportion of red beads in container 1 and p2= the true proportion of red beads in container 2. Which of the following is the correct standardized test statistic and P-value for the hypotheses,

Trending nowThis is a popular solution!
Step by stepSolved in 2 steps with 2 images

- In a certain class of 25 students, 12% received A’s, 30% received B’s, 42% received C’s, and 12% received D’s. How many students failed the class?arrow_forwardDr. Lawrence has minimized his wardrobe during the fall of 2020, since there's no reason to dress up fancy these days. He has three pairs of jeans, five sweatshirts, and four hats that he puts to regular use. If he were to select his outfit for the day at random, how many different jean-sweatshirt-hat combinations are there? 6.arrow_forwardIn a bag of 330 chocolate candies, 34 of them are brown. The candy company claims that 13% of its plain chocolate candies are brown. For the following, assume that the claim of 13% is true, and assume that a sample consists of 330 chocolate candies. a. Values of ? brown candies or greater are significantly high.arrow_forward
- 2. One of the mascots received exactly 28 votes. Which mascot was it? Number of votes 50 40 20 10 0 Eagle O A. eagle OB. lion OC. bear OD. wolf Students' Favorite Mascot Lion Bear Wolfarrow_forwardDr. Wagner is interested in conducting a 2 x 2 x 3 within-group factorial design, with 20 participants in each cell. How many participants does she need overall? a. 40 b. 240 c. 20 d. 80arrow_forwardWhich of the following could be the number of players on each team?arrow_forward
- A population has SS = 30 and σ2 = 3. How many scores are in the population?arrow_forwardOnly answer the last two questions: A group of 62 students was surveyed, and it was found that each of the students surveyed liked at least one of the following three fruits: apricot, bananas, and cantaloupes. 34 liked apricots 30 liked bananas 33 liked cantaloupes 11 liked apricots and bananas 15 liked bananas and cantaloupes 17 liked apricots and cantaloupes 19 liked exactly two of the fruits How many students liked: a. bananas or apricots? Answer: 53 b. apricots and bananas but not cantaloupes? Answer: 3 c. cantaloupes or apricots but not bananas? Answer: 33 d. at least two of the fruits? _______ e. at most two of the fruits? ________Note: show the detailed and clear solutionarrow_forwardThere are 5 black, 3 white, and 4 yellow balls in a box (THE SAME BOX as seen in the previous question). Four balls are randomly selected without replacement. Let Y be the number of yellow balls selected. Find P[Y =2]. 5 3 в w О а. About 21% O b. About 25% С. About 34%. d. About 9.3% e. About 13%arrow_forward
- The advertisements boast that 30% of the cereal in each box is raisins. If the box contains 2 cups of nuts, what percentage of each box is nuts?arrow_forwardAmy has two ways to travel from her home in Norco to her office in Los Angeles. One is to go via the 10 Freeway, and the other is to go via 60 Freeway. In order to determine which way she should travel on a daily basis, Amy has recorded the travel times for samples of eight trips via the 10 Freeway and eight trips via the 60 Freeway. The following table gives the travel times (in minutes) for the sixteen trips: Travel times in minutes 10 Freeway 73, 69, 72, 71, 73, 73, 72, 73 60 Freeway 80, 75, 68, 72, 73, 81, 67, 75 Assume that the two populations of travel times are normally distributed and that the population variances are equal. Can we conclude, at the 0.1 level of significance, that the mean travel times of the two routes are different? Perform a two-tailed test. Then fill in the table below. Carry your intermediate computations to at least three decimal places and round your answers as specified in the table. (If necessary, consult a list…arrow_forward3. We are interested in seeing if 4-ounce chocolate bars are being accurately created to contain 4-ounces. Random samples of size 6 were taken and weighed. Five hours of observation provided the following data: Sample Меan Range 1 3.91 0.10 I. 4.07 0.16 3.85 0.17 4 4.02 0.19 3.83 0.22 2. 3.arrow_forward
 MATLAB: An Introduction with ApplicationsStatisticsISBN:9781119256830Author:Amos GilatPublisher:John Wiley & Sons Inc
 Probability and Statistics for Engineering and th...StatisticsISBN:9781305251809Author:Jay L. DevorePublisher:Cengage Learning
 Statistics for The Behavioral Sciences (MindTap C...StatisticsISBN:9781305504912Author:Frederick J Gravetter, Larry B. WallnauPublisher:Cengage Learning
 Elementary Statistics: Picturing the World (7th E...StatisticsISBN:9780134683416Author:Ron Larson, Betsy FarberPublisher:PEARSON
 The Basic Practice of StatisticsStatisticsISBN:9781319042578Author:David S. Moore, William I. Notz, Michael A. FlignerPublisher:W. H. Freeman
 Introduction to the Practice of StatisticsStatisticsISBN:9781319013387Author:David S. Moore, George P. McCabe, Bruce A. CraigPublisher:W. H. Freeman


