
MATLAB: An Introduction with Applications
6th Edition
ISBN: 9781119256830
Author: Amos Gilat
Publisher: John Wiley & Sons Inc
expand_more
expand_more
format_list_bulleted
Related questions
Question
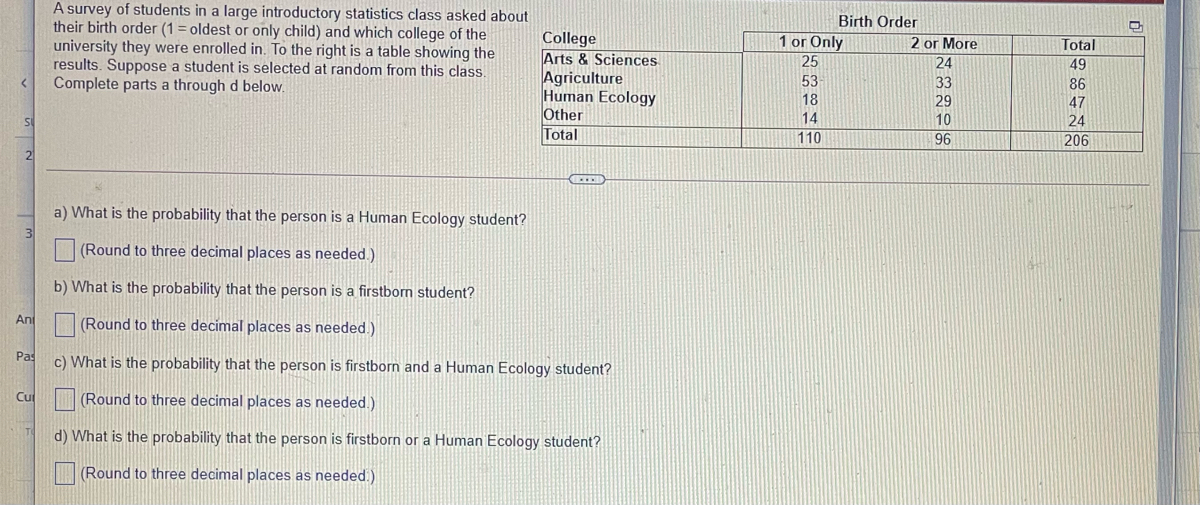

Transcribed Image Text:A survey of students in a large introductory statistics class asked about
their birth order (1 = oldest or only child) and which college of the
university they were enrolled in. To the right is a table showing the
results. Suppose a student is selected at random from this class.
Complete parts a through d below.
Birth Order
College
Arts & Sciences
Agriculture
Human Ecology
Other
Total
1 or Only
2 or More
24
Total
25
49
53
18
33
29
10
96
86
47
24
S
14
110
206
2
a) What is the probability that the person is a Human Ecology student?
3
(Round to three decimal places as needed.)
b) What is the probability that the person is a firstborn student?
Ani
(Round to three decimal places as needed.)
Pas
c) What is the probability that the person is firstborn and a Human Ecology student?
Cul
(Round to three decimal places as needed.)
d) What is the probability that the person is firstborn or a Human Ecology student?
(Round to three decimal places as needed.)
Expert Solution
This question has been solved!
Explore an expertly crafted, step-by-step solution for a thorough understanding of key concepts.

Step by stepSolved in 2 steps with 2 images

Knowledge Booster

Similar questions
- Given the data set A = {0, 0, 12, 13, 14, 15, 16, 18, 22, 25, 30} which of the following is a true statement? O There are two modes for the data set. O The mean is greater than the median. O The mean and the median have the same value. O There is no mode for the data.arrow_forwardTwo sections of statistics are offered, the first at 8 a.m. and the second at 10 a.m. The 8 a.m. section has 25 women, and the 10 a.m. section has 15 women. A student claims this is evidence that women prefer earlier statistics classes than men do. What information is missing that might contradict this claim? Question content area bottom Part 1 Choose the best answer below. A. The professor may be female in one class and male in the other, which could affect the female students' class preference. B. The percentage of female students in the two classes is unknown. There may be more females in the 8 a.m. because there are more students in the 8 a.m. class than the 10 a.m. class. This claim could be true only if the classes were the same size. C. The age and class standing of the students is unknown. Older female students may prefer later classes, so it may be only younger female students who prefer earlier classes. D. No information is…arrow_forwardCan you do a histogram for Class 0-0.19, 0.20-0.39, 0.40-0.59, 0.60-0.79,0.80-0.99, 1.00-1.19, 1.20-1.39, Frequencies 25, 13, 5, 2, 2, 2, 3.arrow_forward
- A new statistics book has been written and a faculty member and a student are asked to rank the new book and the other five best statistics books. How much do the student and professor agree on their assessment of the books (1 being the favorite, 6 being the least)? Use the data below to answer the following question:arrow_forward2. Please answer this question ASAP. Please circle all answers, please be organized.arrow_forwardA math professor is wondering if students today are better or worse than in the past. He has given the same final to this year's class that he gave ten years ago. Compute mean, median, and mode for both classes and write a paragraph summarizing the differences. This Year 35 45 65 75 87 80 69 71 53 90 99 95 70 82 73 93 67 61 57 74 72 77 71 81 83 Ten Years Ago 56 77 75 76 59 74 51 89 55 79 67 77 69 91 68 90 65 79 69 79 87 86 98 91 95arrow_forward
- Consider the following Venn diagram that summarizes the data from 50 people. How many people own just one pet? Birds 10 10 1. 2. 2. Cats Dogs 32 22 25 20 cerarrow_forwardIn a city with three high schools, all the ninth graders took a Standardized Test, with these results: High School Mean Test Score Number of ninth graders (Frequency) Glenwood 79 279 Central 94 349 Lincoln 70 161 The city's PR manager, who never took statistics, claimed the mean score of all ninth graders in the city was the average of 79, 94, and 70, which is 81. Of course, that is incorrect. What is the mean score for all ninth graders in the city? Round to one decimal place. Mean of all ninth grader's Scores =arrow_forwardPlease see below. I need this asap please and thank you.arrow_forward
arrow_back_ios
arrow_forward_ios
Recommended textbooks for you
- MATLAB: An Introduction with ApplicationsStatisticsISBN:9781119256830Author:Amos GilatPublisher:John Wiley & Sons Inc
 Probability and Statistics for Engineering and th...StatisticsISBN:9781305251809Author:Jay L. DevorePublisher:Cengage Learning
 Statistics for The Behavioral Sciences (MindTap C...StatisticsISBN:9781305504912Author:Frederick J Gravetter, Larry B. WallnauPublisher:Cengage Learning
  Elementary Statistics: Picturing the World (7th E...StatisticsISBN:9780134683416Author:Ron Larson, Betsy FarberPublisher:PEARSON
 The Basic Practice of StatisticsStatisticsISBN:9781319042578Author:David S. Moore, William I. Notz, Michael A. FlignerPublisher:W. H. Freeman
 Introduction to the Practice of StatisticsStatisticsISBN:9781319013387Author:David S. Moore, George P. McCabe, Bruce A. CraigPublisher:W. H. Freeman
MATLAB: An Introduction with Applications
Statistics
ISBN:9781119256830
Author:Amos Gilat
Publisher:John Wiley & Sons Inc
Probability and Statistics for Engineering and th...
Statistics
ISBN:9781305251809
Author:Jay L. Devore
Publisher:Cengage Learning
Statistics for The Behavioral Sciences (MindTap C...
Statistics
ISBN:9781305504912
Author:Frederick J Gravetter, Larry B. Wallnau
Publisher:Cengage Learning
Elementary Statistics: Picturing the World (7th E...
Statistics
ISBN:9780134683416
Author:Ron Larson, Betsy Farber
Publisher:PEARSON
The Basic Practice of Statistics
Statistics
ISBN:9781319042578
Author:David S. Moore, William I. Notz, Michael A. Fligner
Publisher:W. H. Freeman
Introduction to the Practice of Statistics
Statistics
ISBN:9781319013387
Author:David S. Moore, George P. McCabe, Bruce A. Craig
Publisher:W. H. Freeman