
MATLAB: An Introduction with Applications
6th Edition
ISBN: 9781119256830
Author: Amos Gilat
Publisher: John Wiley & Sons Inc
expand_more
expand_more
format_list_bulleted
Related questions
Question
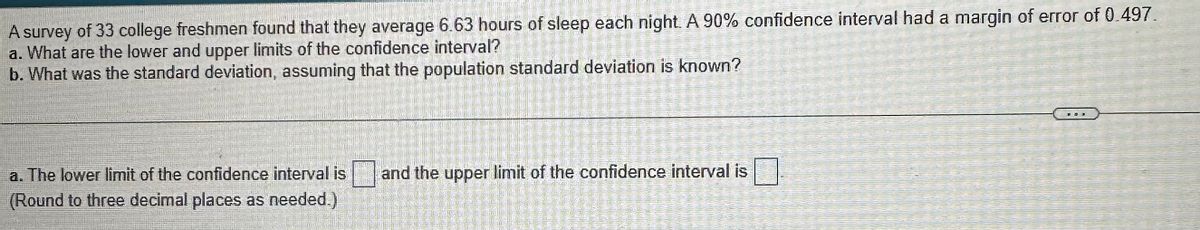

Transcribed Image Text:A survey of 33 college freshmen found that they average 6.63 hours of sleep each night. A 90% confidence interval had a margin of error of 0.497.
a. What are the lower and upper limits of the confidence interval?
b. What was the standard deviation, assuming that the population standard deviation is known?
3320
201
Ristrariis!
Tersey
Tranto ele
Con
TERZS
SABALST
a. The lower limit of the confidence interval is and the upper limit of the confidence interval is
(Round to three decimal places as needed.)
S
20
136 Sierad
THE SENSO
Hengere
ANICURAT
call
THE FIRST T
PH
secon delay
THE POO
Le rasketdas
HUDWIKTSE
SURCH BENGUE
kin
Om Hallla
AS Triseny ute in
VETOVATILE
nin
ne tok pal
TEREORGHINKIN
LEMPANon=
LAINAN
HOTAR ESTA
N
WHAN ORS
DDY
Expert Solution
This question has been solved!
Explore an expertly crafted, step-by-step solution for a thorough understanding of key concepts.

This is a popular solution

Trending nowThis is a popular solution!

Step by stepSolved in 3 steps with 2 images

Knowledge Booster

Similar questions
- Tina catches a 14-pound bass. She does not know the population mean or standard deviation. So she takes a sample of five friends and they say the last bass they caught was 9, 12, 13, 10, and 10 pounds. Find the t and calculate a 95% (α = .05) confidence interval.arrow_forwardA researcher is interested in finding a 90% confidence interval for the mean number minutes students are concentrating on their professor during a one hour statistics lecture. The study included 106 students who averaged 36.5 minutes concentrating on their professor during the hour lecture. The standard deviation was 13.5 minutes. Round answers to 3 decimal places where possible. a. To compute the confidence interval use a ? distribution. b. With 90% confidence the population mean minutes of concentration is between and minutes. c. If many groups of 106 randomly selected members are studied, then a different confidence interval would be produced from each group. About percent of these confidence intervals will contain the true population mean minutes of concentration and about percent will not contain the true population mean minutes of concentration. Hint: Hints 7 Video 2 [+]arrow_forwardA statistics class is estimating the mean height of all female students at their college. They collect a random sample of 42 female students and measure their heights. The mean of the sample is 65.3 inches and the sample standard deviation is 5.4 inches. Find the 90% confidence interval for the mean height of all female students in their school? Assume that the distribution of individual female heights at this school is approximately normal. 1. The t value is 1.3025 2. The standard error has a value of -- 3. The margin of error has a value of 4. Find the 90% confidence interval for the mean height of all female students in their schoolarrow_forward
- Give one method to increase statistical power and Which test statistic should you use if you are comparing two variances?arrow_forwardA random sample of 21 lunch orders at Noodles & Company showed a mean bill of $13.54 with a standard deviation of $6.45. Find the 98 percent confidence interval for the mean bill of all lunch orders. (Round your answers to 4 decimal places.) The 98% confidence interval is from _____to______arrow_forwardA researcher is interested in finding a 95% confidence interval for the mean number minutes students are concentrating on their professor during a one hour statistics lecture. The study included 133 students who averaged 36.1 minutes concentrating on their professor during the hour lecture. The standard deviation was 13.4 minutes. Round answers to 3 decimal places where possible. b. With 95% confidence the population mean minutes of concentration is between and minutes. c. If many groups of 133 randomly selected members are studied, then a different confidence interval would be produced from each group. About percent of these confidence intervals will contain the true population mean minutes of concentration and about percent will not contain the true population mean minutes of concentration.arrow_forward
- A researcher is interested in finding a 98% confidence interval for the mean number of times per day that college students text. The study included 99 students who averaged 32.3 texts per day. The standard deviation was 19.2 texts. Round answers to 3 decimal places where possible. a. To compute the confidence interval use a t distribution. b. With 98% confidence the population mean number of texts per day is between and texts. c. If many groups of 99 randomly selected members are studied, then a different confidence interval would be produced from each group. About percent of these confidence intervals percent will not will contain the true population number of texts per day and about contain the true population mean number of texts per day.arrow_forwardA researcher is interested in finding a 95% confidence interval for the mean number of times per day that college students text. The study included 112 students who averaged 26.7 texts per day. The standard deviation was 24.5 texts. Round answers to 3 decimal places where possible. a. To compute the confidence interval use a distribution. b. With 95% confidence the population mean number of texts per day is between and texts. c. If many groups of 112 randomly selected members are studied, then a different confidence interval would be produced from each group. About percent of these confidence intervals will contain the true population number of texts per day and about percent will not contain the true population mean number of texts per day.arrow_forwardComment on the shape of the distribution. Images attached.arrow_forward
- A researcher is interested in finding a 95% confidence interval for the mean number of times per day that college students text. The study included 137 students who averaged 42.6 texts per day. The standard deviation was 20.6 texts. Round answers to 3 decimal places where possible. a. To compute the confidence interval use a t :v distribution. b. With 95% confidence the population mean number of texts per day is between and texts.arrow_forwardA researcher is interested in finding a 90% confidence interval for the mean number minutes students are concentrating on their professor during a one hour statistics lecture. The study included 117 students who averaged 40.9 minutes concentrating on their professor during the hour lecture. The standard deviation was 11.8 minutes. Round answers to 3 decimal places where possible. a. To compute the confidence interval use a ? distribution. b. With 90% confidence the population mean minutes of concentration is between and minutes. c. If many groups of 117 randomly selected members are studied, then a different confidence interval would be produced from each group. About percent of these confidence intervals will contain the true population mean minutes of concentration and about percent will not contain the true population mean minutes of concentration. Submit Questionarrow_forwardA fitness center is interested in finding a 95% confidence interval for the mean number of days per week that Americans who are members of a fitness club go to their fitness center. Records of 271 members were looked at and their mean number of visits per week was 2.3 and the standard deviation was 1.6. a. To compute the confidence interval use a ? distribution. b. With 95% confidence the population mean number of visits per week is between visits. and c. If many groups of 271 randomly selected members are studied, then a different confidence interval would be produced from each group. About percent of these confidence intervals will contain the true population mean number of visits per week and about percent will not contain the true population mean number of visits per week.arrow_forward
arrow_back_ios
SEE MORE QUESTIONS
arrow_forward_ios
Recommended textbooks for you
- MATLAB: An Introduction with ApplicationsStatisticsISBN:9781119256830Author:Amos GilatPublisher:John Wiley & Sons Inc
 Probability and Statistics for Engineering and th...StatisticsISBN:9781305251809Author:Jay L. DevorePublisher:Cengage Learning
 Statistics for The Behavioral Sciences (MindTap C...StatisticsISBN:9781305504912Author:Frederick J Gravetter, Larry B. WallnauPublisher:Cengage Learning
  Elementary Statistics: Picturing the World (7th E...StatisticsISBN:9780134683416Author:Ron Larson, Betsy FarberPublisher:PEARSON
 The Basic Practice of StatisticsStatisticsISBN:9781319042578Author:David S. Moore, William I. Notz, Michael A. FlignerPublisher:W. H. Freeman
 Introduction to the Practice of StatisticsStatisticsISBN:9781319013387Author:David S. Moore, George P. McCabe, Bruce A. CraigPublisher:W. H. Freeman
MATLAB: An Introduction with Applications
Statistics
ISBN:9781119256830
Author:Amos Gilat
Publisher:John Wiley & Sons Inc
Probability and Statistics for Engineering and th...
Statistics
ISBN:9781305251809
Author:Jay L. Devore
Publisher:Cengage Learning
Statistics for The Behavioral Sciences (MindTap C...
Statistics
ISBN:9781305504912
Author:Frederick J Gravetter, Larry B. Wallnau
Publisher:Cengage Learning
Elementary Statistics: Picturing the World (7th E...
Statistics
ISBN:9780134683416
Author:Ron Larson, Betsy Farber
Publisher:PEARSON
The Basic Practice of Statistics
Statistics
ISBN:9781319042578
Author:David S. Moore, William I. Notz, Michael A. Fligner
Publisher:W. H. Freeman
Introduction to the Practice of Statistics
Statistics
ISBN:9781319013387
Author:David S. Moore, George P. McCabe, Bruce A. Craig
Publisher:W. H. Freeman