MATLAB: An Introduction with Applications
6th Edition
ISBN: 9781119256830
Author: Amos Gilat
Publisher: John Wiley & Sons Inc
expand_more
expand_more
format_list_bulleted
Concept explainers
Question
Statistics ( Sampling Distributions and Estimation )

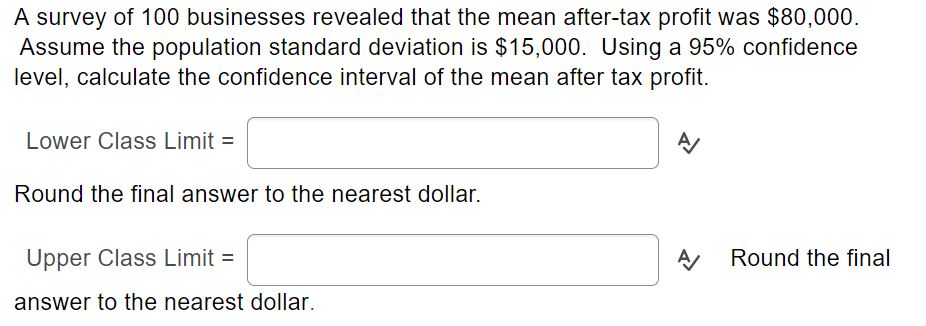
Transcribed Image Text:A survey of 100 businesses revealed that the mean after-tax profit was $80,000.
Assume the population standard deviation is $15,000. Using a 95% confidence
level, calculate the confidence interval of the mean after tax profit.
Lower Class Limit =
Round the final answer to the nearest dollar.
Upper Class Limit =
Round the final
answer to the nearest dollar.
Expert Solution
This question has been solved!
Explore an expertly crafted, step-by-step solution for a thorough understanding of key concepts.
This is a popular solution
Trending nowThis is a popular solution!
Step by stepSolved in 2 steps with 2 images

Knowledge Booster
Learn more about
Need a deep-dive on the concept behind this application? Look no further. Learn more about this topic, statistics and related others by exploring similar questions and additional content below.Similar questions
- Hypothesis test of proportions On April 15th 1912, the R.M.S. Titanic sank into the north atlantic ocean resulting in th loss of more than 1500 passengers and crew. Below is a number of passengers and crew of survivors for the crew, first, second, and third class. Find the proportion of survivors by type of service crew, first, second and third. Test the hypothesis at the 99% confidence level that the proportion of first class survivors is the same as third class (25) What do you calculate for the test statistic: c? what is the critical sttistic? What is the conclusion of your hypothesis test? class passengers survived crew 885 212 first 325 202 second 285…arrow_forwardDistribution: [1,1,4,4,5] What is the sum of squared deviations for this distribution? A/arrow_forwardModeling and Simulation (Poisson Distribution) Q1) The number of hurricanes hitting the coast of Florida annually has a Poisson distribution with a mean of 0.7. What is the probability that more than one hurricanes will hit the Florida coast in a year ?arrow_forward
- Hypothesis test For a certain nationwide standardized test there are two commonly used preparation products on the market: StudyFocus and Prepara. A researcher in the Education department at a nearby university wants to determine if there is any difference between the two products on the mean score on the test by their users. The researcher obtains the scores on the test from a random sample of 16 users of StudyFocus and a random sample of 14 users of Prepara. (These samples are chosen independently.) These data are shown in the table. ? StudyFocus Prepara Send data to calculator 408, 400, 460, 587, 485, 559, 470, 439, 453, 531, 491, 481, 529, 494, 581, 397 510, 553, 504, 525, 549, 500, 525, 561, 510, 493, 498, 512, 517, 546 V Scores Send data to Excel Perform a two-tailed test. Then complete the parts below. Carry your intermediate computations to three or more decimal places. (If necessary, consult a list of formulas.) Explanation Assume that the two populations of scores are…arrow_forwardSubgroup of Participants Supine SBP Mean (SD) Standing SBP Mean (SD) Percent with > 5.0 Decrease Percent with > 5.0 Increase White women (N = 301) 120.4 (18.4) 120.0 (18.8) 32.6% 32.2% African-American women (N = 107) 122.7 (19.3) 122.8 (19.4) 30.2% 31.9% White men (N = 339) 121.2 (18.9) 120.2 (19.9) 39.5% 25.6% African-American men (N = 95) 124.7 (20.4) 125.9 (21.6) 13.7% 51.3% Total (N = 842) 121.5 (19.0) 121.1 (19.5) 29.8% 31.7% Would it be possible to analyze data in table 2 with a chi-square test? if yes, specify howarrow_forward
arrow_back_ios
arrow_forward_ios
Recommended textbooks for you
 MATLAB: An Introduction with ApplicationsStatisticsISBN:9781119256830Author:Amos GilatPublisher:John Wiley & Sons Inc
 Probability and Statistics for Engineering and th...StatisticsISBN:9781305251809Author:Jay L. DevorePublisher:Cengage Learning
 Statistics for The Behavioral Sciences (MindTap C...StatisticsISBN:9781305504912Author:Frederick J Gravetter, Larry B. WallnauPublisher:Cengage Learning
 Elementary Statistics: Picturing the World (7th E...StatisticsISBN:9780134683416Author:Ron Larson, Betsy FarberPublisher:PEARSON
 The Basic Practice of StatisticsStatisticsISBN:9781319042578Author:David S. Moore, William I. Notz, Michael A. FlignerPublisher:W. H. Freeman
 Introduction to the Practice of StatisticsStatisticsISBN:9781319013387Author:David S. Moore, George P. McCabe, Bruce A. CraigPublisher:W. H. Freeman

MATLAB: An Introduction with Applications
Statistics
ISBN:9781119256830
Author:Amos Gilat
Publisher:John Wiley & Sons Inc

Probability and Statistics for Engineering and th...
Statistics
ISBN:9781305251809
Author:Jay L. Devore
Publisher:Cengage Learning

Statistics for The Behavioral Sciences (MindTap C...
Statistics
ISBN:9781305504912
Author:Frederick J Gravetter, Larry B. Wallnau
Publisher:Cengage Learning

Elementary Statistics: Picturing the World (7th E...
Statistics
ISBN:9780134683416
Author:Ron Larson, Betsy Farber
Publisher:PEARSON

The Basic Practice of Statistics
Statistics
ISBN:9781319042578
Author:David S. Moore, William I. Notz, Michael A. Fligner
Publisher:W. H. Freeman

Introduction to the Practice of Statistics
Statistics
ISBN:9781319013387
Author:David S. Moore, George P. McCabe, Bruce A. Craig
Publisher:W. H. Freeman