
MATLAB: An Introduction with Applications
6th Edition
ISBN: 9781119256830
Author: Amos Gilat
Publisher: John Wiley & Sons Inc
expand_more
expand_more
format_list_bulleted
Related questions
Topic Video
Question
A study was conducted to determine if there was a linear relationship between a person's age and hisher peak heart rate.
COMPLETE ALL STEPS
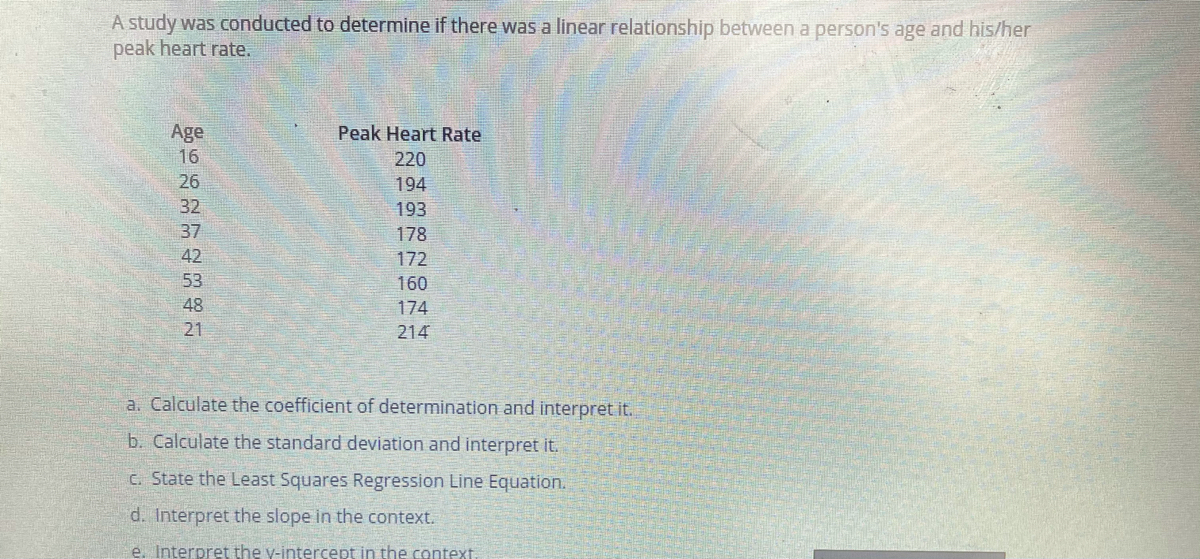

Transcribed Image Text:A study was conducted to determine if there was a linear relationship between a person's age and his/her
peak heart rate.
Age
Peak Heart Rate
16
220
26
194
32
193
37
178
42
172
53
160
48
174
21
214
a. Calculate the coefficient of determination and interpret it.
b. Calculate the standard deviation and interpret it.
c. State the Least Squares Regression Line Equation.
d. Interpret the slope in the context.
e. Interpret the y-intercept in the context
Expert Solution
This question has been solved!
Explore an expertly crafted, step-by-step solution for a thorough understanding of key concepts.

This is a popular solution

Trending nowThis is a popular solution!

Step by stepSolved in 7 steps

Knowledge Booster


Learn more about
Need a deep-dive on the concept behind this application? Look no further. Learn more about this topic, statistics and related others by exploring similar questions and additional content below.Similar questions
- Assuming the lowest decile of men receive an average of $800/month in Social Security, while the highest decile receive $2200/month in Social Security how much does each receive (on average) during their years in retirement. Use the chart called: Predictive Years of Receiving Social Security Benefits. Also use the born in 1940 data.arrow_forwardA random sample of college students was surveyed about how they spend their time each week. The scatterplot below displays the relationship between the number of hours each student typically works per week at a part- or full-time job and the number of hours of television each student typically watches per week. The correlation between these variables is r = –0.63, and the equation we would use to predict hours spent watching TV based on hours spent working is as follows: Predicted hours spent watching TV = 17.21 – 0.23(hours spent working) Since we are using hours spent working to help us predict hours spent watching TV, we’d call hours spent working a(n) __________________ variable and hours spent watching TV a(n) __________________ variable. The correlation coefficient, along with what we see in the scatterplot, tells us that the relationship between the variables has a direction that is _________________ and a strength that is ______________________. According to…arrow_forwardA team from UNHABITAT took a random sample of 230 households in a city to better understand how the size of a house (measured in metres) is related to the number of people living in that house. They performed a regression analysis on the data and found that regression model had an R² = 18.3%. What is the correlation between the size of a house and the number of people living in that house? 0.667 0.183 0.033 0.904 0.428arrow_forward
- Studies have shown that people who suffer sudden cardiac arrest have a better chance of survival if a defibrillator shock is administered very soon after cardiac arrest. How is survival rate related to the time between when cardiac arrest occurs and when the defibrillator shock is delivered? The accompanying data give y = survival rate (percent) and x = mean call-to-shock time (minutes) for a cardiac rehabilitation center (in which cardiac arrests occurred while victims were hospitalized and so the call-to-shock time tended to be short) and for four communities of different sizes. Mean call-to-shock time, x 2 6 79 12 Survival rate, y (a) Construct a scatterplot for these data. y 12. 10 O 8 6 20 40 60 91 44 32 6 4 80 100 y 100 80 60 ELL 40 20 2 4 6 8 X 12 10 8 6 4 20 40 60 (b) Find the equation of the least-squares line. (Round your values to four decimal places.) ŷ= Jx 80 100 10 12 (c) Use the least-squares line to predict survival rate for a community with a mean call-to-shock time of…arrow_forwardA linear model fit to predict weekly Sales of frozen pizza (in kilograms) from the average Price (in dollars per unit) charged by a sample of stores in 41 recent weeks is Sales = 141,870.25-24,445.32 Price. For the data used to create the model, the average Sales was 52,750 kilograms (SD = 10,282 kilograms) and the correlation between Price and Sales was r=-0.554. If the Price in a particular week was 2 SD higher than the mean Price, how much pizza would the model predict was sold that week? The model would predict that kilograms of frozen pizza were sold. (Round to the nearest integer as needed.)arrow_forwardA research study investigates the occurrence of extra heartbeats between untrained and trained older patients at risk for heart attack. Researchers decide to test whether there is a significant difference in the number of extra beats depending on training status. They obtain measurements over 10 minutes, summarized below. What did they find? If there is a significant difference, how big of one is there? (Provide a range.) dfadi = 25 (if needed) Status # patients Untrained 43 Mean # extra beats/10 min 72.46 32.35 Standard Deviation Minimum # extra beats Maximum # of extra beats Skew Kurtosis 28 165 -0.21 0.62 Trained 21 169.50 62.93 66 266 0.13 -0.1arrow_forward
- Forensic scientists can learn about events at a crime scene by collecting data. Ex: Properties of glass shards at a crime scene such as chemical composition can indicate what type of glass was broken at the scene. Possible types include building glass (building windows or doors), vehicle glass (car windows or doors), or household glass (lightbulbs, baking dishes). The fitted logistic regression model for predicting whether a glass shard is building glass based on sodium is: = 20.02+(-1.42) (sodium) 1+e20.02+(-1.42) (sodium) Calculate the log-odds that a glass shard with sodium = 13.08 is building glass. Ex: 1.23 C Calculate the probability that a glass shard with sodium = 13.08 is building glass.arrow_forwardPlease show all work/stepsarrow_forwardPlease see the picture below. I need this asap please and thank you.arrow_forward
- A recent experiment included measuring the weight of a package of raw almonds. This type of data would be considered a: Discrete variable or Continuous variable?arrow_forwardA group of migraine headache sufferers were tracked over their lifetimes with data taken every 10 years. The scatter plot shows the number of headaches per year versus age, in years. How would you estimate the number of headaches at age 100? Question 2 options: Draw a line of best fit and interpolate. Wait until a sufficient number of subjects have reached the age of 100. Draw a line of best fit and extrapolate. Use the number from age 80 and divide by 2.arrow_forwardAn article published in the American Journal of Hypertension reported the results of a longitudinal study on blood pressure. Ten years ago, 51 out of 188 people evaluated were classified as having high blood pressure. This year, 63, out of 194 people evaluated were classified as having high blood pressure. Based on the results of this study, can one conclude that the proportion of people in the population with high blood pressure has increased in the last ten years? Use a = 0.05. I can't find the sign=a I hope someone will know what I am talking about.arrow_forward
arrow_back_ios
SEE MORE QUESTIONS
arrow_forward_ios
Recommended textbooks for you
- MATLAB: An Introduction with ApplicationsStatisticsISBN:9781119256830Author:Amos GilatPublisher:John Wiley & Sons Inc
 Probability and Statistics for Engineering and th...StatisticsISBN:9781305251809Author:Jay L. DevorePublisher:Cengage Learning
 Statistics for The Behavioral Sciences (MindTap C...StatisticsISBN:9781305504912Author:Frederick J Gravetter, Larry B. WallnauPublisher:Cengage Learning
  Elementary Statistics: Picturing the World (7th E...StatisticsISBN:9780134683416Author:Ron Larson, Betsy FarberPublisher:PEARSON
 The Basic Practice of StatisticsStatisticsISBN:9781319042578Author:David S. Moore, William I. Notz, Michael A. FlignerPublisher:W. H. Freeman
 Introduction to the Practice of StatisticsStatisticsISBN:9781319013387Author:David S. Moore, George P. McCabe, Bruce A. CraigPublisher:W. H. Freeman
MATLAB: An Introduction with Applications
Statistics
ISBN:9781119256830
Author:Amos Gilat
Publisher:John Wiley & Sons Inc
Probability and Statistics for Engineering and th...
Statistics
ISBN:9781305251809
Author:Jay L. Devore
Publisher:Cengage Learning
Statistics for The Behavioral Sciences (MindTap C...
Statistics
ISBN:9781305504912
Author:Frederick J Gravetter, Larry B. Wallnau
Publisher:Cengage Learning
Elementary Statistics: Picturing the World (7th E...
Statistics
ISBN:9780134683416
Author:Ron Larson, Betsy Farber
Publisher:PEARSON
The Basic Practice of Statistics
Statistics
ISBN:9781319042578
Author:David S. Moore, William I. Notz, Michael A. Fligner
Publisher:W. H. Freeman
Introduction to the Practice of Statistics
Statistics
ISBN:9781319013387
Author:David S. Moore, George P. McCabe, Bruce A. Craig
Publisher:W. H. Freeman