A study of emergency service facilities investigated the relationship between the number of facilities and the average distance traveled to provide the emergency service. The following table gives the data Number of Facilities Average Distance (miles) 11 1.13 16 0.82 21 0.62 27 0.52 30 0.46 (a) Develop a scatter diagram for these data, treating average distance traveled as the dependent variable. 1.8T 1.6 1.8- 1.6 35 30 1.4- 1.4 1.2- 1.2 25 1. 1. 20 0.8 0.8 0.6 0.6 15 0.4 0.4 10 0.2 0.2 0. 0. 5 5 10 15 20 30 35 5 10 15 Number 20 25 30 35 Number 0. 0.2 0.4 0.6 0.8 1. 1.2 1.4 1.6 1.8 @O Distance Tab 0 1.8 1.6 • 1.4 1.2 1. 0.8 Type here to search Esc FnLock 1 0 LK A Fri I D $ *- % 0105 @ 2 W AJ+ 44 #3 E S N X Alt R T L3 6 > & 7 C 8 * 00 71°F D F G H J K C V B N M 1.2- 1. 1.2- 25 1. 0.8- 0.8 20 0.6- • 0.6 • 15 0.4 0.4 0.2 0.2 10 0. 0. 5 10 15 20 25 30 35 5 10 15 20 25 30 35 5 0. 0.2 0.4 0.6 0.8 1. 1.2 1.4 1.6 1.8 Number Number Distance 1.8 1.6 • 1.4 1.2 1.- 0.8 0.6 0.4 0.2 . 0. 10 15 20 25 30 35 Number (b) Does a simple linear regression model appear to be appropriate? Explain. O No, the scatter diagram suggests that there is no relationship. No, the scatter diagram suggests that there is a curvilinear relationship. O Yes, the scatter diagram suggests that there is a linear relationship. (c) Develop an estimated regression equation for the data corresponding to a second-order model with one predictor variable. (Round your numerical values to four decimal places.) ŷ = Type here to search Esc FnLock 0 A AI F2 2 W N 叮小 *- F3 F4 F5 S #3 E X 20 All 4 لل R % 5 15 T 6 F7 & 7 ° * 00 2 この C D F G H J K C V B N M
A study of emergency service facilities investigated the relationship between the number of facilities and the average distance traveled to provide the emergency service. The following table gives the data Number of Facilities Average Distance (miles) 11 1.13 16 0.82 21 0.62 27 0.52 30 0.46 (a) Develop a scatter diagram for these data, treating average distance traveled as the dependent variable. 1.8T 1.6 1.8- 1.6 35 30 1.4- 1.4 1.2- 1.2 25 1. 1. 20 0.8 0.8 0.6 0.6 15 0.4 0.4 10 0.2 0.2 0. 0. 5 5 10 15 20 30 35 5 10 15 Number 20 25 30 35 Number 0. 0.2 0.4 0.6 0.8 1. 1.2 1.4 1.6 1.8 @O Distance Tab 0 1.8 1.6 • 1.4 1.2 1. 0.8 Type here to search Esc FnLock 1 0 LK A Fri I D $ *- % 0105 @ 2 W AJ+ 44 #3 E S N X Alt R T L3 6 > & 7 C 8 * 00 71°F D F G H J K C V B N M 1.2- 1. 1.2- 25 1. 0.8- 0.8 20 0.6- • 0.6 • 15 0.4 0.4 0.2 0.2 10 0. 0. 5 10 15 20 25 30 35 5 10 15 20 25 30 35 5 0. 0.2 0.4 0.6 0.8 1. 1.2 1.4 1.6 1.8 Number Number Distance 1.8 1.6 • 1.4 1.2 1.- 0.8 0.6 0.4 0.2 . 0. 10 15 20 25 30 35 Number (b) Does a simple linear regression model appear to be appropriate? Explain. O No, the scatter diagram suggests that there is no relationship. No, the scatter diagram suggests that there is a curvilinear relationship. O Yes, the scatter diagram suggests that there is a linear relationship. (c) Develop an estimated regression equation for the data corresponding to a second-order model with one predictor variable. (Round your numerical values to four decimal places.) ŷ = Type here to search Esc FnLock 0 A AI F2 2 W N 叮小 *- F3 F4 F5 S #3 E X 20 All 4 لل R % 5 15 T 6 F7 & 7 ° * 00 2 この C D F G H J K C V B N M

Glencoe Algebra 1, Student Edition, 9780079039897, 0079039898, 2018
18th Edition
ISBN:9780079039897
Author:Carter
Publisher:Carter
Chapter4: Equations Of Linear Functions
Section4.5: Correlation And Causation
Problem 2CYU

Related questions
Question
100%
Only need c
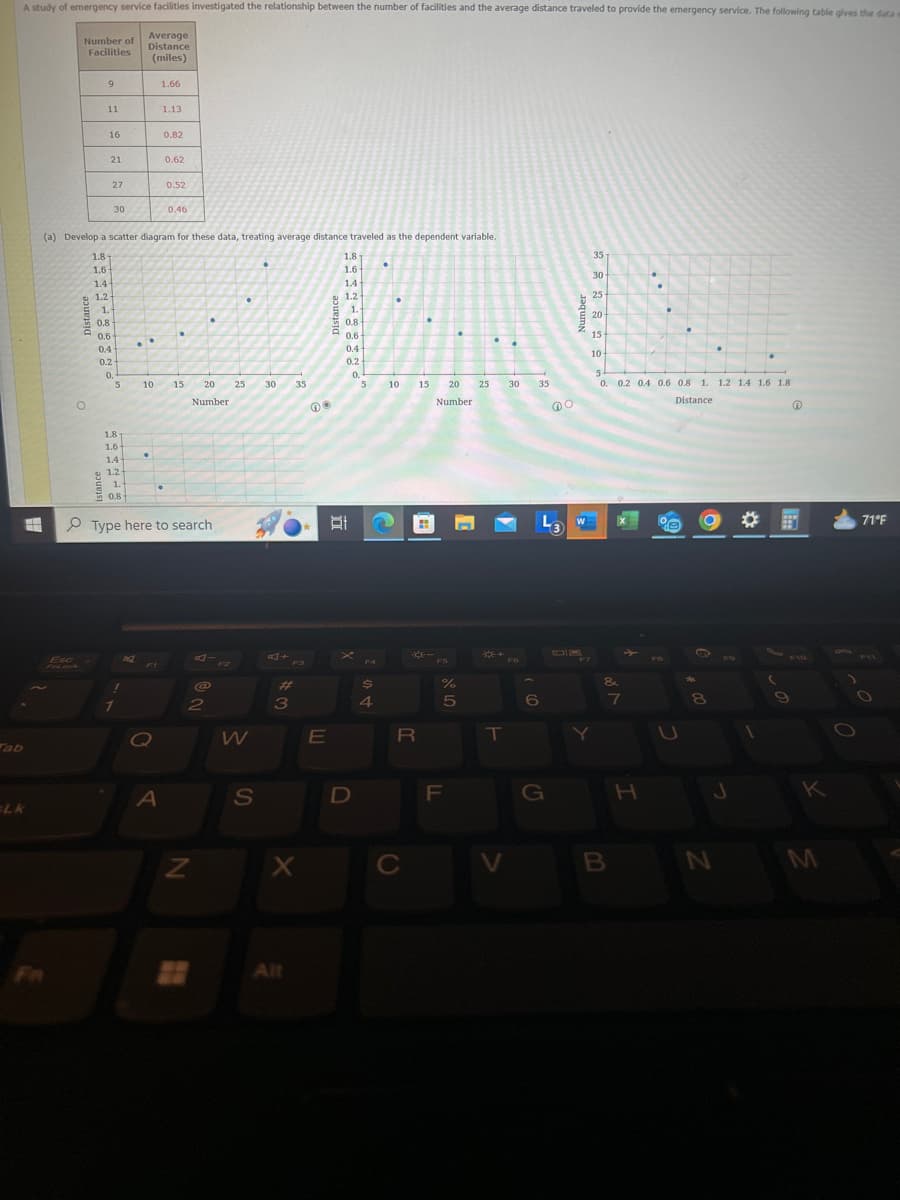
Transcribed Image Text:A study of emergency service facilities investigated the relationship between the number of facilities and the average distance traveled to provide the emergency service. The following table gives the data
Number of
Facilities
Average
Distance
(miles)
11
1.13
16
0.82
21
0.62
27
0.52
30
0.46
(a) Develop a scatter diagram for these data, treating average distance traveled as the dependent variable.
1.8T
1.6
1.8-
1.6
35
30
1.4-
1.4
1.2-
1.2
25
1.
1.
20
0.8
0.8
0.6
0.6
15
0.4
0.4
10
0.2
0.2
0.
0.
5
5
10
15
20
30
35
5
10
15
Number
20 25 30 35
Number
0. 0.2 0.4 0.6 0.8 1.
1.2 1.4 1.6 1.8
@O
Distance
Tab
0
1.8
1.6
•
1.4
1.2
1.
0.8
Type here to search
Esc
FnLock
1
0
LK
A
Fri
I
D
$
*-
%
0105
@
2
W
AJ+
44
#3
E
S
N
X
Alt
R
T
L3
6
>
&
7
C
8
* 00
71°F
D
F
G
H
J
K
C
V
B
N
M
Transcribed Image Text:1.2-
1.
1.2-
25
1.
0.8-
0.8
20
0.6-
•
0.6
•
15
0.4
0.4
0.2
0.2
10
0.
0.
5
10
15
20
25
30
35
5
10
15
20
25
30
35
5
0.
0.2 0.4 0.6 0.8 1. 1.2 1.4 1.6 1.8
Number
Number
Distance
1.8
1.6
•
1.4
1.2
1.-
0.8
0.6
0.4
0.2
.
0.
10
15
20
25
30
35
Number
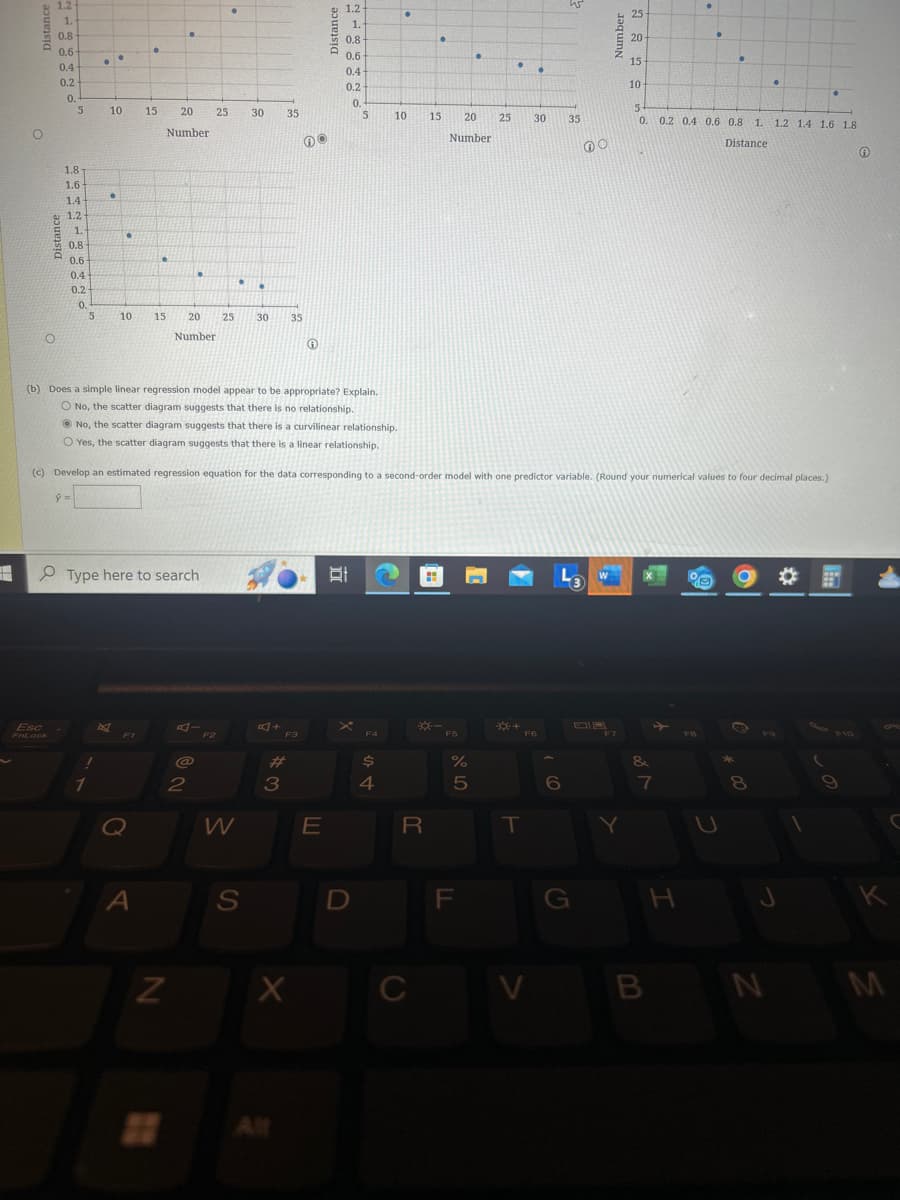
(b) Does a simple linear regression model appear to be appropriate? Explain.
O No, the scatter diagram suggests that there is no relationship.
No, the scatter diagram suggests that there is a curvilinear relationship.
O Yes, the scatter diagram suggests that there is a linear relationship.
(c) Develop an estimated regression equation for the data corresponding to a second-order model with one predictor variable. (Round your numerical values to four decimal places.)
ŷ =
Type here to search
Esc
FnLock
0
A
AI
F2
2
W
N
叮小
*-
F3
F4
F5
S
#3
E
X
20 All
4
لل
R
%
5
15
T
6
F7
&
7
°
* 00
2
この
C
D
F
G
H
J
K
C
V
B
N
M
Expert Solution
This question has been solved!
Explore an expertly crafted, step-by-step solution for a thorough understanding of key concepts.

This is a popular solution!

Trending now
This is a popular solution!

Step by step
Solved in 2 steps with 2 images

Recommended textbooks for you
Glencoe Algebra 1, Student Edition, 9780079039897…
Algebra
ISBN:
9780079039897
Author:
Carter
Publisher:
McGraw Hill

Linear Algebra: A Modern Introduction
Algebra
ISBN:
9781285463247
Author:
David Poole
Publisher:
Cengage Learning

Big Ideas Math A Bridge To Success Algebra 1: Stu…
Algebra
ISBN:
9781680331141
Author:
HOUGHTON MIFFLIN HARCOURT
Publisher:
Houghton Mifflin Harcourt
Glencoe Algebra 1, Student Edition, 9780079039897…
Algebra
ISBN:
9780079039897
Author:
Carter
Publisher:
McGraw Hill
Linear Algebra: A Modern Introduction
Algebra
ISBN:
9781285463247
Author:
David Poole
Publisher:
Cengage Learning
Big Ideas Math A Bridge To Success Algebra 1: Stu…
Algebra
ISBN:
9781680331141
Author:
HOUGHTON MIFFLIN HARCOURT
Publisher:
Houghton Mifflin Harcourt