MATLAB: An Introduction with Applications
6th Edition
ISBN: 9781119256830
Author: Amos Gilat
Publisher: John Wiley & Sons Inc
expand_more
expand_more
format_list_bulleted
Question

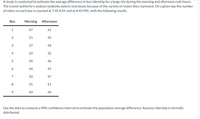
Transcribed Image Text:A study is conducted to estimate the average difference in bus ridership for a large city during the morning and afternoon rush hours.
The transit authority's analyst randomly selects nine buses because of the variety of routes they represent. On a given day the number
of riders on each bus is counted at 7:45 A.M. and at 4:45 P.M., with the following results.
Bus
Morning
Afternoon
1
47
41
51
45
3
44
4
24
32
5
50
46
6
44
41
7
50
47
8
55
51
49
49
Use the data to compute a 90% confidence interval to estimate the population average difference. Assume ridership is normally
distributed.
37

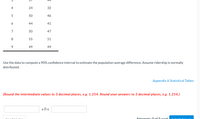
Transcribed Image Text:44
4
24
32
5
50
46
6
44
41
7
50
47
8
55
51
9
49
49
Use the data to compute a 90% confidence interval to estimate the population average difference. Assume ridership is normally
distributed.
Appendix A Statistical Tables
(Round the intermediate values to 3 decimal places, e.g. 1.254. Round your answers to 3 decimal places, e.g. 1.254.)
<Ds
Attomnts: 0 of 3 usecd
C..bne:t A.
Expert Solution
This question has been solved!
Explore an expertly crafted, step-by-step solution for a thorough understanding of key concepts.
This is a popular solution
Trending nowThis is a popular solution!
Step by stepSolved in 2 steps with 3 images

Knowledge Booster
Similar questions
- A city official would like to know if there is public support for increasing funding for arts programs. To collect data, the city official stands outside a concert hall after a show and surveys every 25th person to exit and asks their opinion about raising funds for the arts. Which of the following describes the population in this scenario? all residents of the city the members of the city council all city residents who support the arts the people surveyed by the city officialarrow_forwardThe International League of Triple-A minor league baseball consists of 14 teams organized into three divisions: North, South, and West. Suppose the following data show the average attendance for the 14 teams in the International League. Also shown are the teams' records; W denotes the number of games won, L denotes the number of games lost, and PCT is the proportion of games played that were won. Team Name Buffalo Bisons Lehigh Valley IronPigs Pawtucket Red Sox Rochester Red Wings Scranton-Wilkes Barre Yankees Syracuse Chiefs Charlotte Knights Durham Bulls Norfolk Tides Richmond Braves Columbus Clippers Indianapolis Indians Louisville Bats Toledo Mud Hens Division North North North North North North South South South West West West WL West 66 77 0.462 55 89 0.382 85 58 South 63 78 0.447 PCT 88 56 74 70 0.514 69 73 0.594 0.611 0.486 69 73 74 70 0.514 64 78 0.451 63 78 0.447 0.486 68 76 0.472 88 56 0.611 75 69 0.521 Attendance 8,819 8,478 9,099 6,917 7,141 5,769 4,525 6,998 6,284 4,451…arrow_forwardThe director of library services at a college did a survey of types of books (by subject) in the circulation library. Then she used library records to take a random sample of 888 books checked out last term and classified the books in the sample by subject. The results are shown below. Subject Area Percent of Books on Subject in CirculationLibrary on This Subject Number of Books inSample on This Subject Business 32% 247 Humanities 25% 209 Natural Science 20% 222 Social Science 15% 127 All other subjects 8% 83 Using a 5% level of significance, test the claim that the subject distribution of books in the library fits the distribution of books checked out by students. (a) What is the level of significance?State the null and alternate hypotheses. H0: The distributions are the same.H1: The distributions are different.H0: The distributions are different.H1: The distributions are different. H0: The distributions are the same.H1: The distributions are the same.H0: The…arrow_forward
- Virginia polled a large sample of individuals to find the percentage of students with known food allergies and the percentage of students without known food allergies. Which of the following could sufficiently display the data if only the two given categories are to be included? Select the correct answer below: bar graph pie chart either a pie chart or a bar graph neither a pie chart nor a bar grapharrow_forwardA case-control study was conducted to examine the association between lung cancer and smoking in men. The case group contains 500 patients, who were diagnosed with lung cancer. Five hundred age-matched patients were recruited as controls. The study found that 50% of cases were regular smoking and the proportion is 20% among controls. a. Create a 2x2 table based on the given informationarrow_forwardThe director of library services at a college did a survey of types of books (by subject) in the circulation library. Then she used library records to take a random sample of 888 books checked out last term and classified the books in the sample by subject. The results are shown below. Subject Area Percent of Books on Subject in CirculationLibrary on This Subject Number of Books inSample on This Subject Business 32% 284 Humanities 25% 218 Natural Science 20% 207 Social Science 15% 102 All other subjects 8% 77 (b) Find the value of the chi-square statistic for the sample. (Round the expected frequencies to three decimal places. Round the test statistic to three decimal places.)arrow_forward
- The director of library services at a college did a survey of types of books (by subject) in the circulation library. Then she used library records to take a random sample of 888 books checked out last term and classified the books in the sample by subject. The results are shown below. Subject Area Percent of Books on Subject in CirculationLibrary on This Subject Number of Books inSample on This Subject Business 32% 237 Humanities 25% 220 Natural Science 20% 223 Social Science 15% 128 All other subjects 8% 80 Using a 5% level of significance, test the claim that the subject distribution of books in the library fits the distribution of books checked out by students. (a) What is the level of significance?State the null and alternate hypotheses. H0: The distributions are the same.H1: The distributions are different.H0: The distributions are the same.H1: The distributions are the same. H0: The distributions are different.H1: The distributions are different.H0: The…arrow_forwardA manufacturing plant makes computer chips 24 hours a day. Employees work one of three, 8 hour shifts during the morning (2am-10am), day (10am-6pm), and night (6pm-2am). Below are data on the number of defective chips on a randomly chosen 24 hour period. Shift Morning Day Night Number of Defective Chips 23 26 47 Total Chips Manufactured 330 330 330 The plant manager thinks there might be more defective computer chips manufactured during the night shift compared to the day shift. Give appropriate statistical evidence to test the managers' claim.arrow_forwardThe director of library services at a college did a survey of types of books (by subject) in the circulation library. Then she used library records to take a random sample of 888 books checked out last term and classified the books in the sample by subject. The results are shown below. Subject Area Percent of Books on Subject in CirculationLibrary on This Subject Number of Books inSample on This Subject Business 32% 267 Humanities 25% 217 Natural Science 20% 222 Social Science 15% 109 All other subjects 8% 73 Using a 5% level of significance, test the claim that the subject distribution of books in the library fits the distribution of books checked out by students. (a) What is the level of significance?State the null and alternate hypotheses. H0: The distributions are different.H1: The distributions are the same.H0: The distributions are the same.H1: The distributions are different. H0: The distributions are the same.H1: The distributions are the same.H0: The…arrow_forward
arrow_back_ios
arrow_forward_ios
Recommended textbooks for you
 MATLAB: An Introduction with ApplicationsStatisticsISBN:9781119256830Author:Amos GilatPublisher:John Wiley & Sons Inc
 Probability and Statistics for Engineering and th...StatisticsISBN:9781305251809Author:Jay L. DevorePublisher:Cengage Learning
 Statistics for The Behavioral Sciences (MindTap C...StatisticsISBN:9781305504912Author:Frederick J Gravetter, Larry B. WallnauPublisher:Cengage Learning
 Elementary Statistics: Picturing the World (7th E...StatisticsISBN:9780134683416Author:Ron Larson, Betsy FarberPublisher:PEARSON
 The Basic Practice of StatisticsStatisticsISBN:9781319042578Author:David S. Moore, William I. Notz, Michael A. FlignerPublisher:W. H. Freeman
 Introduction to the Practice of StatisticsStatisticsISBN:9781319013387Author:David S. Moore, George P. McCabe, Bruce A. CraigPublisher:W. H. Freeman

MATLAB: An Introduction with Applications
Statistics
ISBN:9781119256830
Author:Amos Gilat
Publisher:John Wiley & Sons Inc

Probability and Statistics for Engineering and th...
Statistics
ISBN:9781305251809
Author:Jay L. Devore
Publisher:Cengage Learning

Statistics for The Behavioral Sciences (MindTap C...
Statistics
ISBN:9781305504912
Author:Frederick J Gravetter, Larry B. Wallnau
Publisher:Cengage Learning

Elementary Statistics: Picturing the World (7th E...
Statistics
ISBN:9780134683416
Author:Ron Larson, Betsy Farber
Publisher:PEARSON

The Basic Practice of Statistics
Statistics
ISBN:9781319042578
Author:David S. Moore, William I. Notz, Michael A. Fligner
Publisher:W. H. Freeman

Introduction to the Practice of Statistics
Statistics
ISBN:9781319013387
Author:David S. Moore, George P. McCabe, Bruce A. Craig
Publisher:W. H. Freeman