
MATLAB: An Introduction with Applications
6th Edition
ISBN: 9781119256830
Author: Amos Gilat
Publisher: John Wiley & Sons Inc
expand_more
expand_more
format_list_bulleted
Related questions
Question
Based on the results of the regression, what would be the mose likely conclusion?
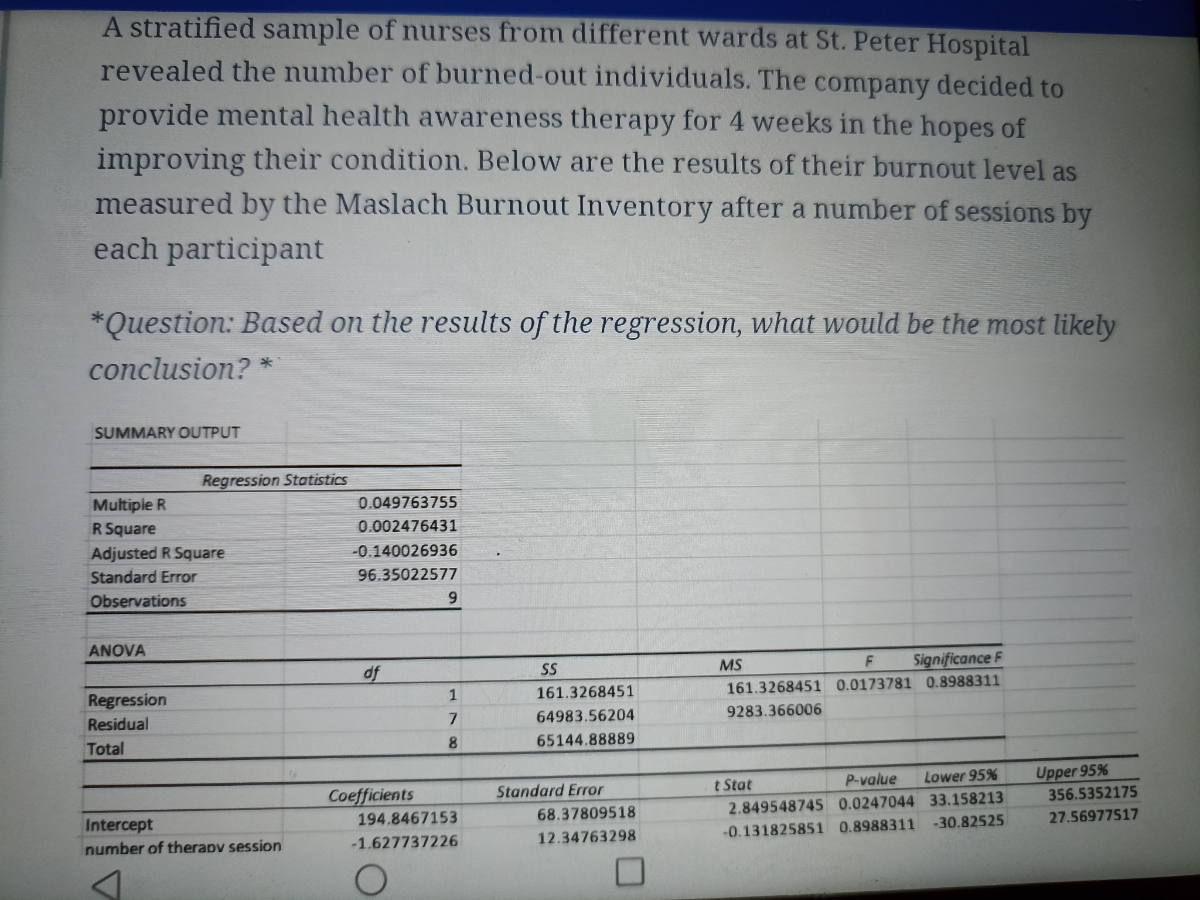

Transcribed Image Text:A stratified sample of nurses from different wards at St. Peter Hospital
revealed the number of burned-out individuals. The company decided to
provide mental health awareness therapy for 4 weeks in the hopes of
improving their condition. Below are the results of their burnout level as
measured by the Maslach Burnout Inventory after a number of sessions by
each participant
*Question: Based on the results of the regression, what would be the most likely
conclusion?
SUMMARY OUTPUT
Regression Statistics
Multiple R
0.049763755
R Square
0.002476431
-0.140026936
Adjusted R Square
Standard Error
96.35022577
Observations
9
ANOVA
MS
Significance F
df
SS
161.3268451
161.3268451 0.0173781 0.8988311
Regression
Residual
64983.56204
9283.366006
8.
65144.88889
Total
Upper 95%
356.5352175
P-value
Lower 95%
t Stat
2.849548745 0.0247044 33.158213
Standard Error
Coefficients
194.8467153
68.37809518
27.56977517
Intercept
-30.82525
12.34763298
-0.131825851 0.8988311
number of therapv session
-1.627737226
Expert Solution
This question has been solved!
Explore an expertly crafted, step-by-step solution for a thorough understanding of key concepts.

Step by stepSolved in 2 steps

Knowledge Booster

Similar questions
- A regression line for predicting test scores has an r.m.s. error of 8 points. When this result is used to predict test scores, about 95% of the predictions will be right to within how many points.arrow_forwardWould the regression in Equation be useful for predicting test scoresin a school district in Massachusetts? Why or why not?arrow_forwardThe mall has a set of data with employee age (X) and the corresponding number of annual on-the-job-accidents(Y). Analysis on the set finds that the regression equation is Y=100-3X. What is the likely number of accidents for someone aged 30? 97 100 10 none of the abovearrow_forward
- For a multiple regression analysis with 2 and 12 degrees of freedom, MS regression is 135 and MS residual is 15. What is the decision for this test?arrow_forwardAn admissions counselor is looking to determine an equation that relates the graduate grade point averages of students who are newly admitted to an academic program with their undergraduate GPA, their GRE scores, and the number of years they have been out of college. What is the correct format for a multiple regression equation? Select the correct answer below: yˆ=b0+b1x1+b2x2+b3x3 yˆ=b1x1+b2x2+b3x3 yˆ=b0+b1x1+b2x2+b3x3+b4x4 yˆ=b0+b1x1+b2x2arrow_forwardThe following table gives the data for the hours students spent on homework and their grades on the first test. The equation of the regression line for this data is yˆ=43.097+1.15x. This equation is appropriate for making predictions at the 0.01 level of significance. If a student spent 32 hours on their homework, make a prediction for their grade on the first test. Round your prediction to the nearest whole number. Hours Spent on Homework and Test Grades Hours Spent on Homework 30 30 31 42 11 27 34 47 5 29 Grade on Test 83 75 75 96 45 76 97 85 53 75arrow_forward
- When should a regression model not be used to make a prediction?arrow_forwardExplain what a residual is and how this relates to the best-fit regression model.arrow_forwardSuppose you wanted to test whether or not the payoff to an additional year of education was the same for men and women in the STEM majors. How would you set up your regression analysis in this casearrow_forward
- If you have 2 datasets on which you have conducted a regression analysis, how would you determine whether you can combine them into one dataset?arrow_forwardSuppose the following estimated regression equation was determined to predict salary based on years of experience. Estimated Salary = 29,136.63 +2257.51(Years of Experience) What is the estimated salary for an employee with 24 years of experience? Answer Keypad Keyboard Shortcuts Tablesarrow_forward
arrow_back_ios
arrow_forward_ios
Recommended textbooks for you
- MATLAB: An Introduction with ApplicationsStatisticsISBN:9781119256830Author:Amos GilatPublisher:John Wiley & Sons Inc
 Probability and Statistics for Engineering and th...StatisticsISBN:9781305251809Author:Jay L. DevorePublisher:Cengage Learning
 Statistics for The Behavioral Sciences (MindTap C...StatisticsISBN:9781305504912Author:Frederick J Gravetter, Larry B. WallnauPublisher:Cengage Learning
  Elementary Statistics: Picturing the World (7th E...StatisticsISBN:9780134683416Author:Ron Larson, Betsy FarberPublisher:PEARSON
 The Basic Practice of StatisticsStatisticsISBN:9781319042578Author:David S. Moore, William I. Notz, Michael A. FlignerPublisher:W. H. Freeman
 Introduction to the Practice of StatisticsStatisticsISBN:9781319013387Author:David S. Moore, George P. McCabe, Bruce A. CraigPublisher:W. H. Freeman
MATLAB: An Introduction with Applications
Statistics
ISBN:9781119256830
Author:Amos Gilat
Publisher:John Wiley & Sons Inc
Probability and Statistics for Engineering and th...
Statistics
ISBN:9781305251809
Author:Jay L. Devore
Publisher:Cengage Learning
Statistics for The Behavioral Sciences (MindTap C...
Statistics
ISBN:9781305504912
Author:Frederick J Gravetter, Larry B. Wallnau
Publisher:Cengage Learning
Elementary Statistics: Picturing the World (7th E...
Statistics
ISBN:9780134683416
Author:Ron Larson, Betsy Farber
Publisher:PEARSON
The Basic Practice of Statistics
Statistics
ISBN:9781319042578
Author:David S. Moore, William I. Notz, Michael A. Fligner
Publisher:W. H. Freeman
Introduction to the Practice of Statistics
Statistics
ISBN:9781319013387
Author:David S. Moore, George P. McCabe, Bruce A. Craig
Publisher:W. H. Freeman