
MATLAB: An Introduction with Applications
6th Edition
ISBN: 9781119256830
Author: Amos Gilat
Publisher: John Wiley & Sons Inc
expand_more
expand_more
format_list_bulleted
Related questions
Concept explainers
Question
A statistical program is recommended.
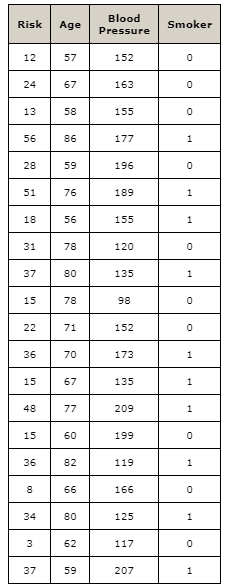
A 10-year study conducted by the American Heart Association provided data on how age, blood pressure, and smoking relate to the risk of strokes. Data from a portion of this study follow. Risk is interpreted as the probability (times 100) that a person will have a stroke over the next 10-year period. For the smoker variable, 1 indicates a smoker and 0 indicates a nonsmoker.
--Using age, blood pressure, and whether a person is a smoker, develop an estimated regression equation that can be used to predict risk. Use x1 for age, x2 for blood pressure, and x3 for whether a person is a smoker. (Round your constant term to one decimal place and coefficients to three decimal places.)

Expert Solution
This question has been solved!
Explore an expertly crafted, step-by-step solution for a thorough understanding of key concepts.

This is a popular solution

Trending nowThis is a popular solution!

Step by stepSolved in 2 steps with 2 images

Knowledge Booster


Learn more about
Need a deep-dive on the concept behind this application? Look no further. Learn more about this topic, statistics and related others by exploring similar questions and additional content below.Similar questions
- The first, second, and third quartile of age at diagnosis of breast cancer among Asian Americans are 42 years, 54 years, and 62 years, respectively. Suppose age at diagnosis of breast cancer has a normal distribution in the population of Asian Americans. The mode of the age at diagnosis of breast cancer among Asian Americans is _____arrow_forward84 tires in a factory are tested for defectiveness. 12% of tires made in the factory are defective. The expected mean of the defective tires is ...arrow_forwardIn a bumper test, three types of autos were deliberately crashed into a barrier at 5 mph, and the resulting damage (in dollars) was estimated. Five test vehicles of each type were crashed, with the results shown below. Research question: Are the mean crash damages the same for these three vehicles? Crash Damage ($) Goliath Varmint Weasel 1,660 1,290 1,000 770 1,440 2,120 880 1,320 1,850 1,960 1,820 1,210 1,240 960 1,960 Click here for the Excel Data File Fill in the missing data. (Round your p-value to 4 decimal places, mean values to 1 decimal place, and other answers to 2 decimal places.) Crash Damage in Dollars Goliath Varmint Weasel 1660 1290 1000 770 1440 2120 880 1320 1850 1960 1820 1210 1240 960 1960arrow_forward
- According to a retail organization, holiday shoppers spent an average of $935.58 over the Thanksgiving weekend in 2016. The accompanying data show the amount spent by a random sample of holiday shoppers during the same weekend in 2017. $1,029 $875 $969 $838 $825 $813 $962 $1,032 $990 $996 $921 $664 $1,013 $1,030 $979 $878 Complete parts a through c. Test the hypothesis that shoppers spent less than an average of $935.58 over the Thanksgiving weekend in 2017 using α=0.05.arrow_forwardThe average monthly grocery bill for an individual is normally distributed with a mean of $85 and a standard deivation of $20. If you select 4 individuals, what is the probability that their mean grocery bill is between $50 and $65?arrow_forwardUsing the same anti-venom study, answer the following questions. A study was done on children (6 months to 18 years of age) who had (nonlethal) scorpion stings. Researchers wanted to know the effectiveness of a new anti-venonm. Each child was randomly assigned to receive a shot of the anti-venom or a placebo shot. Researchers recorded whether or not their condition improved over the next four hours. a. Identify the population for the study. b. Identify the sample for the study. (HINT: See #1) c. Was this an observational study or a controlled experiment? Explain how you know. d. Assuming the rest of the study was well-designed, use your answers to discuss whether it would be reasonable to conclude that the new anti-venom is effective at treating nonlethal scorpion stings in children. For the toolbar, press ALT+F10 (PC) or ALT+FN+F10 (Mac). TTTTParagraph Arial 3 (12pt) 三,三,T. 回i:公 E=E= = T T, U HTML CSS O Mashupsarrow_forward
- . The number of death due to diabetes and kidney disease for an American during 2015 is respectively 68,500 and 42,100. What is the relative frequency probability of death due to diabetes for an American during 2015? How much greater is the risk of death due to diabetes than the risk of death due to kidney disease?arrow_forwardIn a study examining the relation of math ability to the belief that math ability was innate, the belief was considered the predictor variable. The researcher hopes to find a correlation between the participants’ math ability and their belief that math ability is innate. The scores for the three participants are shown below. The group that believed that math is NOT innate scored 66, 70, 50. The group that believed that math IS innate scored 7, 4,10. what are the mean and SD for each group?arrow_forwardA researcher conducted a study on 241 participants to see which plant color they were most likely to select. Using the chart below, what is the probability that someone would choose a plant that wasn't green or red? Plant Color Green Pink Red 50 Frequency 20.74% 100 Purple 20 71arrow_forward
- Use the following information to answer the question. Many couples believe that it is getting too expensive to host an "average" wedding in the United States. According to the website www.costofwedding.com,theaveragecostofaweddingintheU.S.in 2009 was $24,066. Recently, in a random sample of 40 weddings in the U.S. it was found that the average cost of a wedding was $23,224, with a standard deviation of $2,903. On the basis of this, a 9 5% confidence interval for the mean cost of weddings in the U.S. is $22,296 to $24,152. Does the confidence interval provide evidence that the mean cost of a wedding has decreased? Explain your reasoning.arrow_forwardYou read that a study was conducted as a 3 x2 ANOVA. This study had how many independent variables? Question 12 options: 1 2 5 6arrow_forwardUse the three-read strategy to understand the following exercise from a statistics textbook, and then proceed to complete the exercise. Suppose that in a study to determine if hormone therapy increases risk of venous thrombosis in menopausal women, each person in a sample of 589 women who had been diagnosed with venous thrombosis was classified according to hormone use. Each woman in a sample of 2,243 women who had not been diagnosed with venous thrombosis was also classified according to hormone use. Data from the study are given in the accompanying table. The women in each of the two samples were selected at random from patients at a large HMO in a certain U.S. state. Current Hormone Use None EsterifiedEstrogen ConjugatedEquineEstrogen Venous Thrombosis 382 86 121 No VenousThrombosis 1,439 505 299 Is there convincing evidence that the proportions of those who would fall into each of the hormone use categories are not the same for women who have been diagnosed with…arrow_forward
arrow_back_ios
SEE MORE QUESTIONS
arrow_forward_ios
Recommended textbooks for you
- MATLAB: An Introduction with ApplicationsStatisticsISBN:9781119256830Author:Amos GilatPublisher:John Wiley & Sons Inc
 Probability and Statistics for Engineering and th...StatisticsISBN:9781305251809Author:Jay L. DevorePublisher:Cengage Learning
 Statistics for The Behavioral Sciences (MindTap C...StatisticsISBN:9781305504912Author:Frederick J Gravetter, Larry B. WallnauPublisher:Cengage Learning
  Elementary Statistics: Picturing the World (7th E...StatisticsISBN:9780134683416Author:Ron Larson, Betsy FarberPublisher:PEARSON
 The Basic Practice of StatisticsStatisticsISBN:9781319042578Author:David S. Moore, William I. Notz, Michael A. FlignerPublisher:W. H. Freeman
 Introduction to the Practice of StatisticsStatisticsISBN:9781319013387Author:David S. Moore, George P. McCabe, Bruce A. CraigPublisher:W. H. Freeman
MATLAB: An Introduction with Applications
Statistics
ISBN:9781119256830
Author:Amos Gilat
Publisher:John Wiley & Sons Inc
Probability and Statistics for Engineering and th...
Statistics
ISBN:9781305251809
Author:Jay L. Devore
Publisher:Cengage Learning
Statistics for The Behavioral Sciences (MindTap C...
Statistics
ISBN:9781305504912
Author:Frederick J Gravetter, Larry B. Wallnau
Publisher:Cengage Learning
Elementary Statistics: Picturing the World (7th E...
Statistics
ISBN:9780134683416
Author:Ron Larson, Betsy Farber
Publisher:PEARSON
The Basic Practice of Statistics
Statistics
ISBN:9781319042578
Author:David S. Moore, William I. Notz, Michael A. Fligner
Publisher:W. H. Freeman
Introduction to the Practice of Statistics
Statistics
ISBN:9781319013387
Author:David S. Moore, George P. McCabe, Bruce A. Craig
Publisher:W. H. Freeman