
MATLAB: An Introduction with Applications
6th Edition
ISBN: 9781119256830
Author: Amos Gilat
Publisher: John Wiley & Sons Inc
expand_more
expand_more
format_list_bulleted
Related questions
Question
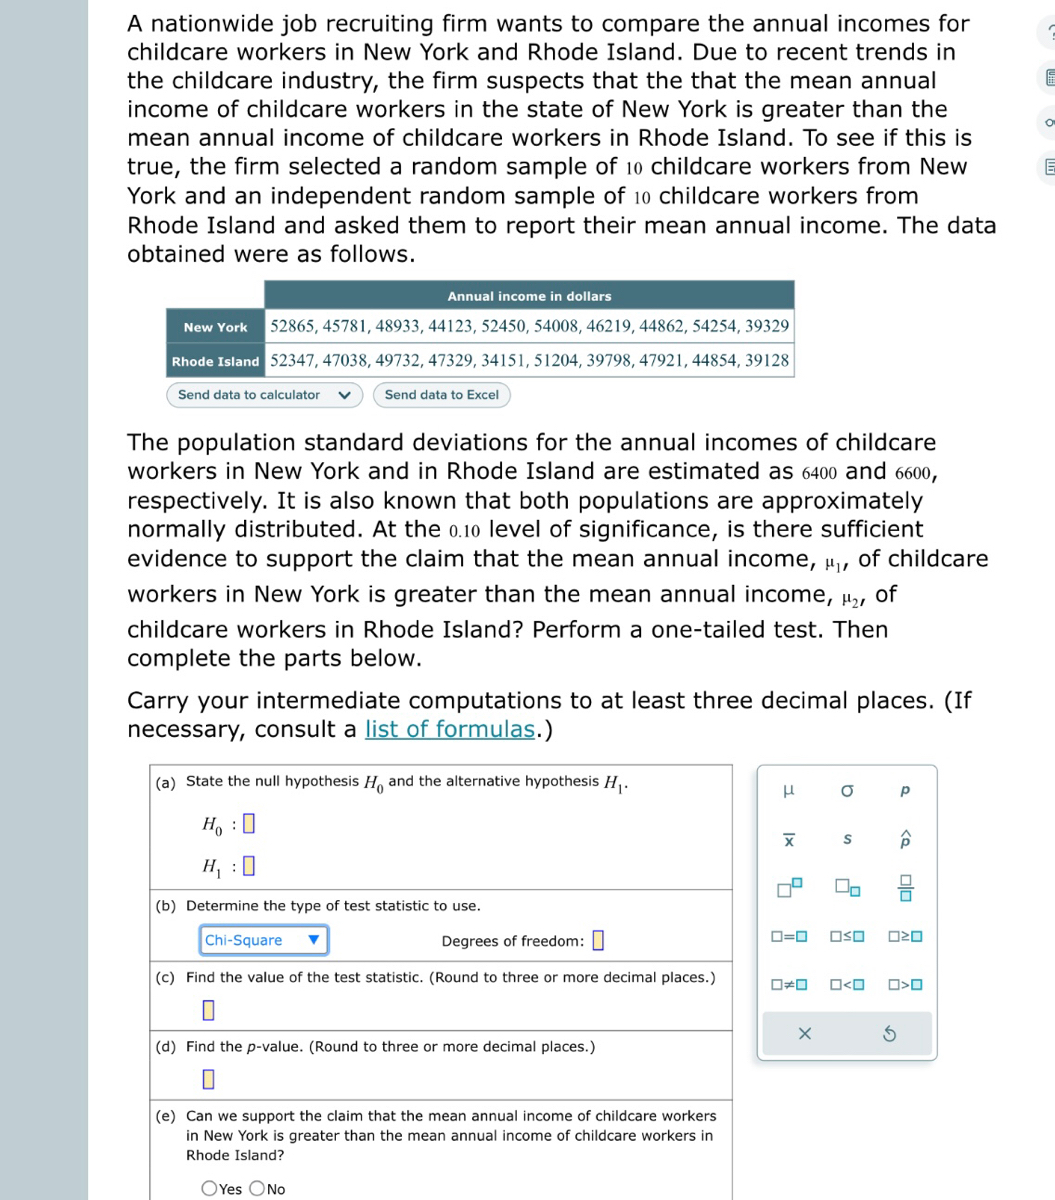

Transcribed Image Text:A nationwide job recruiting firm wants to compare the annual incomes for
childcare workers in New York and Rhode Island. Due to recent trends in
the childcare industry, the firm suspects that the that the mean annual
income of childcare workers in the state of New York is greater than the
mean annual income of childcare workers in Rhode Island. To see if this is
true, the firm selected a random sample of 10 childcare workers from New
York and an independent random sample of 10 childcare workers from
Rhode Island and asked them to report their mean annual income. The data
obtained were as follows.
Annual income in dollars
New York 52865, 45781, 48933, 44123, 52450, 54008, 46219, 44862, 54254, 39329
Rhode Island 52347, 47038, 49732, 47329, 34151, 51204, 39798, 47921, 44854, 39128
Send data to calculator
Send data to Excel
The population standard deviations for the annual incomes of childcare
workers in New York and in Rhode Island are estimated as 6400 and 6600,
respectively. It is also known that both populations are approximately
normally distributed. At the 0.10 level of significance, is there sufficient
evidence to support the claim that the mean annual income, ₁, of childcare
workers in New York is greater than the mean annual income, ₂,
of
childcare workers in Rhode Island? Perform a one-tailed test. Then
complete the parts below.
Carry your intermediate computations to at least three decimal places. (If
necessary, consult a list of formulas.)
(a) State the null hypothesis H and the alternative hypothesis H₁.
HO
H₁ : 0
(b) Determine the type of test statistic to use.
Chi-Square
Degrees of freedom:
(c) Find the value of the test statistic. (Round to three or more decimal places.)
(d) Find the p-value. (Round to three or more decimal places.)
0
(e) Can we support the claim that the mean annual income of childcare workers
in New York is greater than the mean annual income of childcare workers in
Rhode Island?
OYes No
H
XI
00
O
X
S
0=0 OSO
00
O<O
Р
<Q
olo
ロマロ
>O
O
E
Expert Solution
This question has been solved!
Explore an expertly crafted, step-by-step solution for a thorough understanding of key concepts.

Step by stepSolved in 2 steps

Knowledge Booster

Similar questions
- You are conducting a multinomial hypothesis test (α = 0.05) for the claim that all 5 categories are equally likely to be selected. Complete the table. Category ObservedFrequency ExpectedFrequency A 10 B 16 C 8 D 20 E 14 What is the chi-square test-statistic for this data? (Report answer accurate to three decimal places.)χ2=What are the degrees of freedom for this test? d.f.= What is the p-value for this sample? (Report answer accurate to four decimal places.) p-value = The p-value is... less than (or equal to) αα greater than αα This test statistic leads to a decision to... reject the null accept the null fail to reject the null accept the alternative As such, the final conclusion is that... There is sufficient evidence to warrant rejection of the claim that all 5 categories are equally likely to be selected. There is not sufficient evidence to warrant rejection of the claim that all 5 categories are equally likely to be selected. The sample data…arrow_forwardTest the hypothesis using the P-value approach. Be sure to verify the requirements of the test. Ho: p=0.7 versus H: p> 0.7 n3D200, x = 150, a=0.05 Click here to view page 1 of the table. Click here to view page 2 of the table. Calculate the test statistic, Zo- Zo = (Round to two decimal places as needed.) Identify the P-value. P-value D (Round to three decimal places as needed.) Choose the correct result of the hypothesis test for the P-value approach below. O A. Do not reject the null hypothesis, because the P-value is less than a. Do not reiect the null hvnothesis hecauSe the Pavalue is areater than o Click to select your answer(s). M12 Ch 10 Test, MML (part 2 of 2)arrow_forwardX4.2.27 Assigned Media v Question Help v 34% of working mothers do not have enough money to cover their health insurance deductibles. You randomly select six working mothers and ask them whether they have enough money to cover their health insurance deductibles. The random variable represents the number of working mothers who do not have enough money to cover their health insurance deductibles. Complete parts (a) through (c) below. 4 0.087 5 0.018 0.002 (Round to the nearest thousandth as needed.) (b) Graph the binomial distribution using a histogram and describe its shape. Choose the correct graph below. A. OB. OD. AP(X) AP(x) AP(x) AP(x) 4 6 Describe the shape of the histogram. Choose the correct answer below. O A. Skewed right O B. Symmetrical O C. Skewed left O D. None of these Click to select your answer and then click Check Answer. Clear All Final Check part remaining 10:39 PM O e a D 40) 2/9/2021 P Type here to search Home 立arrow_forward
- Consider the data. xi 1 2 3 4 5 yi 3 7 5 11 14 (D) Use the t test to test the following hypotheses (? = 0.05): H0: β1 = 0 Ha: β1 ≠ 0 Find the value of the test statistic. (Round your answer to three decimal places.) =____ Find the p-value. (Round your answer to four decimal places.) p-value = _____ State your conclusion. (A) Reject H0. We cannot conclude that the relationship between x and y is significant.(B) Do not reject H0. We cannot conclude that the relationship between x and y is significant. (C) Do not reject H0. We conclude that the relationship between x and y is significant. (D) Reject H0. We conclude that the relationship between x and y is significant. (E) Use the F test to test the hypotheses in part (d) at a 0.05 level of significance. Present the results in the analysis of variance table format. Set up the ANOVA table. (Round your values for MSE and F to two decimal places, and your p-value to three decimal…arrow_forward#6arrow_forwardQuestion list O O Question 21 O Question 22 O Question 23 Question 24 Question 25 Question 26 uestion 27 estion 28 stion 29 ↓ K The P-value for a hypothesis test is shown. Use the P-value to decide whether to reject Ho when the level of significance is (a) a = 0.01, (b) a = 0.05, and (c) a=0.10. P=0.0138 (a) Do you reject or fail to reject Ho at the 0.01 level of significance? OA. Fail to reject Ho because the P-value, 0.0138, is less than α=0.01. OB. Fail to reject Ho because the P-value, 0.0138, is greater than a = 0.01. OC. Reject Ho because the P-value, 0.0138, is less than a = 0.01. OD. Reject Ho because the P-value, 0.0138, is greater than a = 0.01. (b) Do you reject or fail to reject Ho at the 0.05 level of significance? O A. Reject Ho because the P-value, 0.0138, is less than a = 0.05. OB. Reject Ho because the P-value, 0.0138, is greater than a = 0.05. OC. Fail to reject Ho because the P-value, 0.0138, is less than a = 0.05. O D. Fail to reject Ho because the P-value, 0.0138,…arrow_forward
- Test the hypothesis using the P-value approach. Be sure to verify the requirements of the test. Ho: p = 0.8 versus H₁: p > 0.8 n = 125; x = 105; α = 0.1 Click here to view page 1 of the table. Click here to view page 2 of the table. Calculate the test statistic, Zo. Zo (Round to two decimal places as needed.) Identify the P-value. = P-value = (Round to three decimal places as needed.) Choose the correct result of the hypothesis test for the P-value approach below. A. Do not reject the null hypothesis, because the P-value is less than a. B. Do not reject the null hypothesis, because the P-value is greater than α. C. Reject the null hypothesis, because the P-value is greater than a. O D. Reject the null hypothesis, because the P-value is less than α.arrow_forwardHelp with finding: test statistic p Value reject null hypothesisarrow_forwardDetermine the test statistic for this hypothesis test. (Round to two decimal places as needed.)arrow_forward
- Test the hypothesis using the P-value approach. Be sure to verify the requirements of the test. H0: p=0.9 versus H1: p>0.9 n=200; x=190; α= 0.05 Calculate the test statistic, z0.arrow_forwardScenario: I'm interested in whether there is a relationship between Team (A vs. B) and Outcome (Good vs. Bad). Below are the data. Test the null hypothesis that the categories are independent. α= .05. Team A Team B Good Outcome fo = 75 fe = fo = 45 fe = Bad Outcome fo = 25 fe = fo = 5 fe = degrees of freedom, df = ______, and the Chi Square critical boundary = ______arrow_forwardHow is the hatching of water python eggs influenced by the temperature of the snake's nest? Researchers randomly assigned newly laid eggs to one of three water temperatures: hot, neutral, or cold. Hot duplicates the extra warmth provided by the mother python, and cold duplicates the absence of the mother. The table shows the result of the experiment. The researchers will use a chi-square test for homogeneity to analyze the findings. Hatching status Yes No Total Cold 16 11 27 Water Temperature Neutral Hot 38 75 18 56 104 Total 129 58 187 Which of the following is false? All of the conditions are met for conducting a chi- square test for homogeneity. The data came from 3 groups in a randomized experiment. All expected counts are at least 5. The 10% condition is met. The 10% condition is not needed because the eggs were not randomly selected from the population. Incorrectarrow_forward
arrow_back_ios
SEE MORE QUESTIONS
arrow_forward_ios
Recommended textbooks for you
- MATLAB: An Introduction with ApplicationsStatisticsISBN:9781119256830Author:Amos GilatPublisher:John Wiley & Sons Inc
 Probability and Statistics for Engineering and th...StatisticsISBN:9781305251809Author:Jay L. DevorePublisher:Cengage Learning
 Statistics for The Behavioral Sciences (MindTap C...StatisticsISBN:9781305504912Author:Frederick J Gravetter, Larry B. WallnauPublisher:Cengage Learning
  Elementary Statistics: Picturing the World (7th E...StatisticsISBN:9780134683416Author:Ron Larson, Betsy FarberPublisher:PEARSON
 The Basic Practice of StatisticsStatisticsISBN:9781319042578Author:David S. Moore, William I. Notz, Michael A. FlignerPublisher:W. H. Freeman
 Introduction to the Practice of StatisticsStatisticsISBN:9781319013387Author:David S. Moore, George P. McCabe, Bruce A. CraigPublisher:W. H. Freeman
MATLAB: An Introduction with Applications
Statistics
ISBN:9781119256830
Author:Amos Gilat
Publisher:John Wiley & Sons Inc
Probability and Statistics for Engineering and th...
Statistics
ISBN:9781305251809
Author:Jay L. Devore
Publisher:Cengage Learning
Statistics for The Behavioral Sciences (MindTap C...
Statistics
ISBN:9781305504912
Author:Frederick J Gravetter, Larry B. Wallnau
Publisher:Cengage Learning
Elementary Statistics: Picturing the World (7th E...
Statistics
ISBN:9780134683416
Author:Ron Larson, Betsy Farber
Publisher:PEARSON
The Basic Practice of Statistics
Statistics
ISBN:9781319042578
Author:David S. Moore, William I. Notz, Michael A. Fligner
Publisher:W. H. Freeman
Introduction to the Practice of Statistics
Statistics
ISBN:9781319013387
Author:David S. Moore, George P. McCabe, Bruce A. Craig
Publisher:W. H. Freeman