
MATLAB: An Introduction with Applications
6th Edition
ISBN: 9781119256830
Author: Amos Gilat
Publisher: John Wiley & Sons Inc
expand_more
expand_more
format_list_bulleted
Related questions
Question
Time to spend on task data
504 / 267 /220 / 322 / 538 / 542.
428/ 481 / 413 / 302/ 602
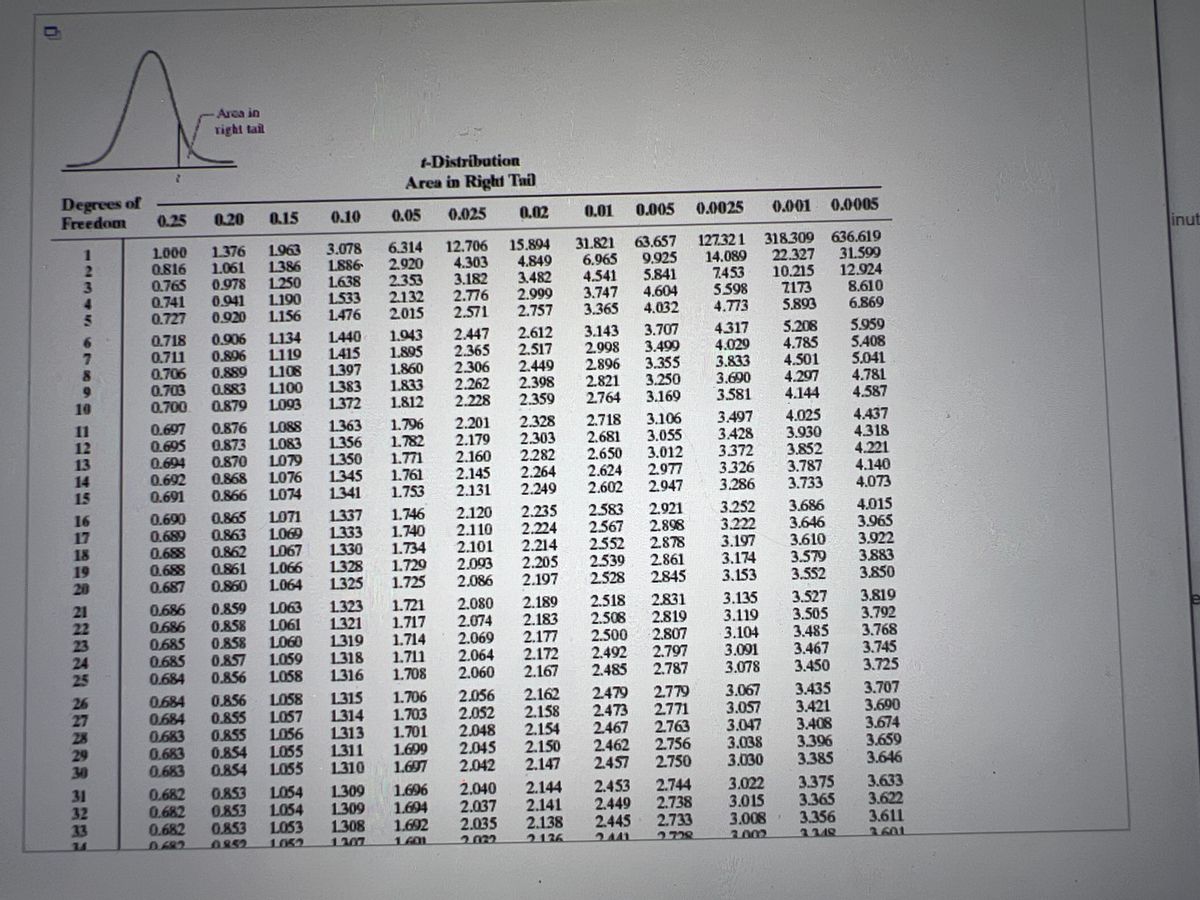

Transcribed Image Text:Degrees of
Freedom 0.25
12445
CESTA MAA#9 25928 52332 3533A ARRE
6
7
8
10
11
12
13
14
15
16
17
18
19
20
21
24
26
30
31
32
33
0.690
0.689
1.000
0.816
0.765
0.741
0.727 0.920
0.688
0.865
0.863
0.862
0.861
0.687 0.860
0.688
1.963
1.386
0.978
1.250
1.190
0.941
1.156
1134
0.906
0.718
1.440
1.415
0.711 0.896 1.119
1.108
0.889
0.706
0.703 0.883 1.100 1.383
1.397
0.879
1.093
1.372
0.700
0.697 0.876
0.695 0.873
0.694 0.870
0.692 0.868
0.691 0.866
0.686
0.686
0.859
0.858
0.858
0.685 0.857
0.856
0.685
Area in
right tail
0.684
0.20
0.684
1.376
1.061
0.684
0.683
0.15
1088
1.083
1.079
1.076
1074
1071
1.069
1.067
1.066
1.064
0.10
1.058
1057
1.056
1.055
1.055
3.078
1.886
2.353
1.638
1.533
2.132
1.476 2.015
1.063
1.323
1.061 1.321
1060
1.319
1.059
1.058
0.853 1054
0.853 1053
0852
t-Distribution
Area in Right Tail
0.025
0.02
12.706 15.894
4.303
4.849
3.182
3.482
2.999
2.757
0.05
6.314
2.920
1.318
1316
1.796
1.363
1.356
1.782
1.350
1.771
1.345
1.761
1.341
1.753
0.856
1.315 1.706
0.855
1.314
1.703
1.701
0.855
1.313
0.683
0.854
1.311
1.699
1.310 1.697
0.683 0.854
0.682 0.853
0.682
0.682
0.682
1054 1.309
1.309
1.308
1.943
1.895
1.860
1.833
1.812
1.337
1.746
1.740
1.333
1.330
1.734
1.328 1.729
1.325
1.725
2.776
2.571
1.721
1.717
1.714
1.711
1.708
2.201
2.179
2.160
2.145
2.131
2.447
2.517
2.365
2.306
2.262
2.228
2.080
2.074
2.069
2.064
2.060
0.01 0.005 0.0025 0.001 0.0005
31.821
6.965
318.309 636.619
63.657 127.321
22.327
14.089
9.925
31.599
4.541
10.215
12.924
5.841
3.747 4.604
7.453
5.598
7173
8.610
3.365
4.032
4.773
5.893
6.869
3.143
2.612
3.707
2.998 3.499
2.896 3.355
2.449
2.359
2.821 3.250
2.398
3.169
2.764
3.106
2.718
2.681
3.055
2.650 3.012
2.977
2.947
2.056
2.052
2.048
2.045
2.042
2.120
2.235
2.224
2.110
2.101
2.214
2.093
2.205
2.086 2.197
2.328
2.303
2.282
2.624
2.264
2.249
2.602
2.189
2.183
2.177
2.172
2.167
2.583
2.567
2.552
2.539
2.528
2.921
2.898
2.878
2.861
2.845
2.518
2.831
2.508
2.819
2.500
2.807
2.492 2.797
2.485
2.787
1.696 2.040
2.144
1.694
2.037
2.141
1.692
2.138
2.035
1.601
2.032
2.479
2.162
2.158
2.473
2.154
2.467
2.462
2.150
2.147
2.457
2.779
2.771
2.763
2.756
2.750
2.453
2.744
2.449
2.738
2.445 2.733
4.317
5.959
4.029
5.408
3.833
5.041
3.690
4.781
3.581 4.144 4.587
3.497
3.428
3.372
3.326
3.286
3.252
3.222
3.197
3.174
3.153
3.135
3.119
3.104
3.091
3.078
5.208
4.785
4.501
4.297
3.022
3.015
3.008
3.002
4.025
3.930
3.852
3.787
3.733
3.686
3.646
3.610
3.579
3.552
3.527
3.505
3.485
3.467
3.450
3.067
3.435
3.057
3.421
3.047 3.408
3.038
3.396
3.030
3.385
3.375
3.365
3.356
1248
4.437
4.318
4.221
4.140
4.073
4.015
3.965
3.922
3.883
3.850
3.819
3.792
3.768
3.745
3.725
3.707
3.690
3.674
3.659
3.646
3.633
3.622
3.611
inut
e

Transcribed Image Text:It is suggested by college mathematics instructors that students spend 2 hours outside class studying for every hour in class. So, for a 4-credit-hour math class, students should spend at
least 8 hours (480 minutes) studying each week. The given data represent the time spent on task recorded (in minutes) for randomly selected students during the third week of the
semester. Determine if the evidence suggests students may not, in fact, be following the advice. That is, does the evidence suggest students are studying less than 480 minutes
each week? Use α = 0.05 level of significance. Note: A normal probability plot and boxplot indicate that the data come from a population that is normally distributed with no outliers.
Complete parts (a) through (e) below.
Click here to view the time spent on task data. Click here to view a table of critical t-values.
(a) State the null and alternative hypotheses.
Но
min
H₁:
min
(Type integers or decimals. Do not round.)
(b) Determine the test statistic.
to = (Round to two decimal places as needed.)
(c) Determine a range for the P-value.
The P-value is in the range
www
(d) The P-value for this hypothesis test using Student's t-distribution is 0.073. Interpret this result:
We would expect a sample mean of minutes or less to occur in about of every 100 repetitions of this study.
(Type integers or decimals. Round to one decimal place as needed.)
(e) Write a conclusion based on the results. Use α = 0.05.
the null hypothesis. There
sufficient evidence to conclude the mean number of minutes studying is
480 minutes.
Expert Solution
This question has been solved!
Explore an expertly crafted, step-by-step solution for a thorough understanding of key concepts.

This is a popular solution

Trending nowThis is a popular solution!

Step by stepSolved in 2 steps with 2 images

Knowledge Booster

Similar questions
- In IBM SPSS, what does clicking on this icon do?arrow_forwardJohnson Filtration, Inc., provides maintenance service for water-filtration systems throughout southern Florida. Suppose that in addition to information on the number of months since the machine was serviced and whether a mechanical or an electrical repair was necessary, the managers obtained a list showing which repairperson performed the service. The revised data follow. Time bo + b₁ Months + b₂ Type + b3 Person Round your answers to three decimal places. bo b₁ b₂ b3 Repair Time in Hours 2.8 3.0 4.7 1.9 2.9 4.8 4.2 4.9 4.3 4.4 0000 Months Since Last Service 2 6 8 3 a. Develop the estimated regression equation to predict the repair time given the number of months since the last maintenance service, the type of repair, and the repairperson who performed the service. Assume that ₂ = 1 if the type of repair is electrical and 3 = 1 if Dave Newton performed the service. Enter negative value as negative number. 2 7 9 8 4 6 Type of Repair Electrical Mechanical Electrical Mechanical…arrow_forwardEvery day a school bus driver passes the same traffic light twice, once before school and once after. Each time he passes the light, he records if it is red, green, or yellow. Here is a summary of the data he got after 200 days. Traffic light before school red red red green green green yellow yellow yellow Traffic light after school red green yellow red green yellow red green yellow Number of days 25 38 12 34 36 11 16 13 15 Suppose the driver will continue recording the colors for 150 more days. In how many of these 150 days will the light be yellow exactly once? Use the data to make a prediction.arrow_forward
- Please give the excel formula or spreadsheet.arrow_forwardSet A: n = 5; x = 10Set B: n = 50; x = 10(a) Suppose the number 32 is included as an additional data value in Set A. Compute x for the new data set. To compute x for the new data set, add 32 to x of the original data set and divide by 6. (Round your answer to two decimal places.) b.) Suppose the number 32 is included as an additional data value in Set B. Compute x for the new data set. (Round your answer to two decimal places.)arrow_forwardNumber of ChildrenTable 1 shows the number of women (per 1000) between 15 and 50 years of age who have been married grouped by the number of children they have had. Table 2 gives the same information for women who have never been married.1 Number of Children Women per 1000 0 162 1 213 2 344 3 182 4 69 5+ 32 Table 1 Women who have been married Number of Children Women per 1000 0 752 1 117 2 72 3 35 4 15 5+ 10 Table 2 Women who have never been married 1http://www.census.gov/hhes/fertility/data/cps/2014.html, Table 1, June 2014. Condition gt requires numbers instead of "null" and "0" (a) Without doing any calculations, which of the two samples appears to have the highest mean number of children? Women who have been marriedWomen who have never been married Which of the distributions appears to have the mean most different from the median? Women who have been marriedWomen who have never been married…arrow_forward
- The table shows the leading causes of death in a certain country in a recent year. The population of the country was 311311 million. If you lived in a typical city of 500,000, how many people would you expect to die of cancercancer each year? Cause Deaths Cause Deaths Heart disease 596 comma 700596,700 Alzheimer's disease 84 comma 90084,900 Cancer 575 comma 300575,300 Diabetes 73 comma 40073,400 Chronic respiratory diseases 143 comma 100143,100 Pneumonia/Influenza 53 comma 40053,400 Stroke 128 comma 600128,600 Kidney disease 45 comma 30045,300 Accidents 122 comma 500122,500 Suicide 38 comma 60038,600 About people would be expected to die of cancer each year. (Type a whole number. Round to the nearest person as needed.)arrow_forwardWeight City MPG 3968 20 3583 22 3470 22 3527 23 3990 18 4724 17 3692 21 3315 22 3616 20 5527 14 3719 16 3097 26 3800 19 3532 25 2269 31 5674 15 3402 20 4029 19 3996 19 3242 23 2434 31 2575 29 2960 27 3618 15 4054 19 3192 24 3305 23 3605 19 4240 15 3933 18 3633 19 3790 17 3477 20 3258 21 4685 17 2776 25 2615 24 3186 21 5137 13 3461 21 4233 16 4178 18 4702 17 3713 22 5794 14 2306 28 3194 26 3428 22 4894 12 4751 17 2605 29 3296 25 5267 13 2789 25 3570 19 4011 18 2363 27 4398 15 2806 25 2127 36 2665 27 3419 24 3427 24 3280 25 5765 13 3465 24 2295 30 3038 22 3070 25 4711 17 3230 24 3528 21 4667 16 SUMMARY OUTPUT Regression Statistics Multiple R 0.894328844 R Square 0.799824082 Adjusted R Square 0.797004703 Standard Error 2.238112689…arrow_forwardplease help me solve this practice question using excel functions 7065 6870 6858 6641 6306 6671 6663 6492 6569 6601 6653 6729 7237 6911 6784 7312 7313 7082 7462 7311 6994 7399 7231 7666 7574 7706 7561 7198 7255 7116 7362 7511 7773 7776 7547 7567 7679 7627 7883 7274 7072 7165 7025 7125 7195 7318 7461 7624 7717 7450 7108 7053 6768 6896 7158 7152 7171 6902 6968 6619 6427 6567 6422 6686 6976 7069 7222 7381 7495 7460 7721 7804 7558 7781 7517 7795 7976 8038 8122 7854 7924 7754 7824 7935 8233 8304 8094 7974 7659 7538 7282 7435 7399 7712 8259 7935 8142 7696 7366 7182 7184 7408 7408 7805 7187 7074 7141 7245 7518 7748 7620 7434 7489 7345 7557 7490 7625 7691 7698 8019 8015 8064 8068 7839 7923 7939 8215 8730 8487 8444 8364 7893 8183…arrow_forward
- The following data are stored in the variable called "data": 2 3 4 7 1 1 0 9 4 2 3 1 Write the MATLAB command that will set the variables equal to the indicated portion of data: 2347 Y =1109 MATLAB Command: Y = 4231 2347 X= 791 MATLAB Command: X = 7 3 Z= 9 1 MATLAB Command: Z = 1 2 4 S= 0 MATLAB Command: S = 3arrow_forwardSex (1=Male 2=Female) 1 2 Total Ever told heart disease (1=Yes 2=No) 1 Count 73 96 169 % within Ever told heart 43.2% 56.8% 100.0% disease (1=Yes 2=No) % within Sex (1=Male 10.2% 9.3% 9.7% 2=Female) % of Total 4.2% 5.5% 9.7% 2 Count 640 941 1581 % within Ever told heart 40.5% 59.5% 100.0% disease (1=Yes 2=No) % within Sex (1=Male 89.8% 90.7% 90.3% 2=Female) % of Total 36.6% 53.8% 90.3% Total Count 713 1037 1750 % within Ever told heart disease (1=Yes 2=No) 40.7% 59.3% 100.0% % within Sex (1=Male 100.0% 100.0% 100.0% 2=Female) % of Total 40.7% 59.3% 100.0% What percent of the sample is male and has heart disease? 4.2% 40.5% 43.2% 10.2%arrow_forward
arrow_back_ios
arrow_forward_ios
Recommended textbooks for you
- MATLAB: An Introduction with ApplicationsStatisticsISBN:9781119256830Author:Amos GilatPublisher:John Wiley & Sons Inc
 Probability and Statistics for Engineering and th...StatisticsISBN:9781305251809Author:Jay L. DevorePublisher:Cengage Learning
 Statistics for The Behavioral Sciences (MindTap C...StatisticsISBN:9781305504912Author:Frederick J Gravetter, Larry B. WallnauPublisher:Cengage Learning
  Elementary Statistics: Picturing the World (7th E...StatisticsISBN:9780134683416Author:Ron Larson, Betsy FarberPublisher:PEARSON
 The Basic Practice of StatisticsStatisticsISBN:9781319042578Author:David S. Moore, William I. Notz, Michael A. FlignerPublisher:W. H. Freeman
 Introduction to the Practice of StatisticsStatisticsISBN:9781319013387Author:David S. Moore, George P. McCabe, Bruce A. CraigPublisher:W. H. Freeman
MATLAB: An Introduction with Applications
Statistics
ISBN:9781119256830
Author:Amos Gilat
Publisher:John Wiley & Sons Inc
Probability and Statistics for Engineering and th...
Statistics
ISBN:9781305251809
Author:Jay L. Devore
Publisher:Cengage Learning
Statistics for The Behavioral Sciences (MindTap C...
Statistics
ISBN:9781305504912
Author:Frederick J Gravetter, Larry B. Wallnau
Publisher:Cengage Learning
Elementary Statistics: Picturing the World (7th E...
Statistics
ISBN:9780134683416
Author:Ron Larson, Betsy Farber
Publisher:PEARSON
The Basic Practice of Statistics
Statistics
ISBN:9781319042578
Author:David S. Moore, William I. Notz, Michael A. Fligner
Publisher:W. H. Freeman
Introduction to the Practice of Statistics
Statistics
ISBN:9781319013387
Author:David S. Moore, George P. McCabe, Bruce A. Craig
Publisher:W. H. Freeman