
MATLAB: An Introduction with Applications
6th Edition
ISBN: 9781119256830
Author: Amos Gilat
Publisher: John Wiley & Sons Inc
expand_more
expand_more
format_list_bulleted
Related questions
Concept explainers
Question
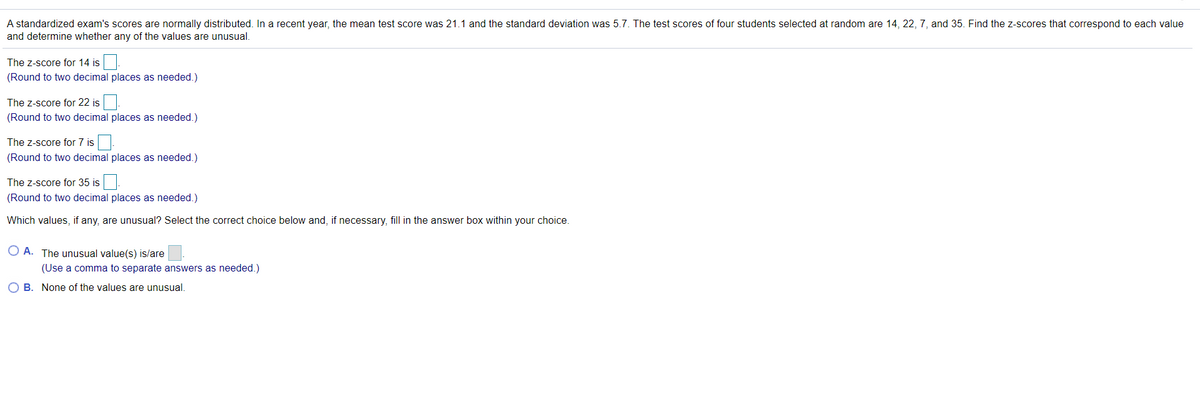

Transcribed Image Text:A standardized exam's scores are normally distributed. In a recent year, the mean test score was 21.1 and the standard deviation was 5.7. The test scores of four students selected at random are 14, 22, 7, and 35. Find the z-scores that correspond to each value
and determine whether any of the values are unusual.
The z-score for 14 is
(Round to two decimal places as needed.)
The z-score for 22 is
(Round to two decimal places as needed.)
The z-score for 7 is
(Round to two decimal places as needed.)
The z-score for 35 is
(Round to two decimal places as needed.)
Which values, if any, are unusual? Select the correct choice below and, if necessary, fill in the answer box within your choice.
O A. The unusual value(s) is/are
(Use a comma to separate answers as needed.)
O B. None of the values are unusual.
Expert Solution
This question has been solved!
Explore an expertly crafted, step-by-step solution for a thorough understanding of key concepts.

This is a popular solution

Trending nowThis is a popular solution!

Step by stepSolved in 2 steps

Knowledge Booster


Learn more about
Need a deep-dive on the concept behind this application? Look no further. Learn more about this topic, statistics and related others by exploring similar questions and additional content below.Similar questions
- Please answer B, C, & D.arrow_forwardIQ Scores Medium Lead Level O High Lead Level 72 n2 = 11 84 92 X2 = 88.555 85 87 S2 = 10.083 %3D 97 83 92 101 111 91 Print Donearrow_forwardUse z scores to compare the given values. The tallest living man at one time had a height of 233 cm. The shortest living man at that time had a height of 89.9 cm. Heights of men at that time had a mean of 176.34 cm and a standard deviation of 5.47 cm. Which of these two men had the height that was more extreme? Since the z score for the tallest man is z= height that was more extreme. (Round to two decimal places.) and the z score for the shortest man is z = the man had thearrow_forward
- Test scores for a history class had a mean of 69 with a standard deviation of 4.5. Test scores for a physics class had a mean of 79 with a standard deviation of 3.5. Suppose a student gets a 75 on the history test and 83 on the physics test. Calculate the z- score for each test. On which test did the student perform better? A. B. C. D. History exam; history z-score is 1.33; physics z-score is 1.14 Physics exam; history z-score is 1.33; physics z-score is 1.14 History exam; history z-score is -1.33; physics z-score is -1.14 Physics exam; history z-score is -1.33; physics z-score is -1.14arrow_forwardWith the extra data value, the range, standard deviation, and variance is?arrow_forwardNote: The standard deviation is defined as the average distance of the class scores from the mean. Note: The variance is defined as average squared distance of the class scores from the mean. Sameer's score in a quiz was 25 and he was five standard deviations above the mean in this quiz. The mean was 20. The average squared distance of the scores from the mean in this quiz is: Select one: a. -3 b. 2 c. 3 d. -2 e. 1 f. -1arrow_forward
- Mario's weekly poker winnings have a mean of $353 and a standard deviation of $67. Last week he won $185. How many standard deviations from the mean is that?arrow_forwardFind the mean and standard deviation of the number of red-headed Scots in a randomly selected group of 155. The probability of having red hair is still 13% for Scottish people. a. Mean = b. Standard deviation (Round to 2 places)=arrow_forwardA successful basketball player has a height of 6 feet 11 inches, or 211 cm. Based on statistics from a data set, his height converts to the z score of 5.17. How many standard deviations is his height above the mean?arrow_forward
- Listed in the data table are IQ scores for a random sample of subjects with medium lead levels in their blood. Also listed are statistics from a study done of IQ scores for a random sample of subjects with high lead levels. Assume that the two samples are independent simple random samples selected from normally distributed populations. Do not assume that the population standard deviations are equal. Complete parts (a) and (b) below. Click the icon to view the data table of IQ scores. a. Use a 0.05 significance level to test the claim that the mean IQ scores for subjects with medium lead levels is higher than the mean for subjects with high lead levels. What are the null and alternative hypotheses? Assume that population 1 consists of subjects with medium lead levels and population 2 consists of subjects with high lead levels. X A. Ho: H₁ H₂ H₁ H₁ H₂ c. Ho: M₁ = H₂ H₁: H₁ H₂ The test statistic is 0.56. (Round to two decimal places as needed.) The P-value is (Round to three decimal…arrow_forwardThe highway mileage (mpg) for a sample of 8 different models of a car company can be found below. Find the mean, median, mode, and standard deviation. Round to one decimal place as needed.20, 22, 26, 27, 30, 31, 34, 34Mean = Median = Mode = Standard Deviation =arrow_forwardStudents in a class took a test whose results were normally distributed. The mean score was an 81 and the standard deviation was 4.5. What score is at the 83rd percentile (round to the nearest whole number.) a.84 b.83 c.85 d.86arrow_forward
arrow_back_ios
SEE MORE QUESTIONS
arrow_forward_ios
Recommended textbooks for you
- MATLAB: An Introduction with ApplicationsStatisticsISBN:9781119256830Author:Amos GilatPublisher:John Wiley & Sons Inc
 Probability and Statistics for Engineering and th...StatisticsISBN:9781305251809Author:Jay L. DevorePublisher:Cengage Learning
 Statistics for The Behavioral Sciences (MindTap C...StatisticsISBN:9781305504912Author:Frederick J Gravetter, Larry B. WallnauPublisher:Cengage Learning
  Elementary Statistics: Picturing the World (7th E...StatisticsISBN:9780134683416Author:Ron Larson, Betsy FarberPublisher:PEARSON
 The Basic Practice of StatisticsStatisticsISBN:9781319042578Author:David S. Moore, William I. Notz, Michael A. FlignerPublisher:W. H. Freeman
 Introduction to the Practice of StatisticsStatisticsISBN:9781319013387Author:David S. Moore, George P. McCabe, Bruce A. CraigPublisher:W. H. Freeman
MATLAB: An Introduction with Applications
Statistics
ISBN:9781119256830
Author:Amos Gilat
Publisher:John Wiley & Sons Inc
Probability and Statistics for Engineering and th...
Statistics
ISBN:9781305251809
Author:Jay L. Devore
Publisher:Cengage Learning
Statistics for The Behavioral Sciences (MindTap C...
Statistics
ISBN:9781305504912
Author:Frederick J Gravetter, Larry B. Wallnau
Publisher:Cengage Learning
Elementary Statistics: Picturing the World (7th E...
Statistics
ISBN:9780134683416
Author:Ron Larson, Betsy Farber
Publisher:PEARSON
The Basic Practice of Statistics
Statistics
ISBN:9781319042578
Author:David S. Moore, William I. Notz, Michael A. Fligner
Publisher:W. H. Freeman
Introduction to the Practice of Statistics
Statistics
ISBN:9781319013387
Author:David S. Moore, George P. McCabe, Bruce A. Craig
Publisher:W. H. Freeman