
MATLAB: An Introduction with Applications
6th Edition
ISBN: 9781119256830
Author: Amos Gilat
Publisher: John Wiley & Sons Inc
expand_more
expand_more
format_list_bulleted
Related questions
Question
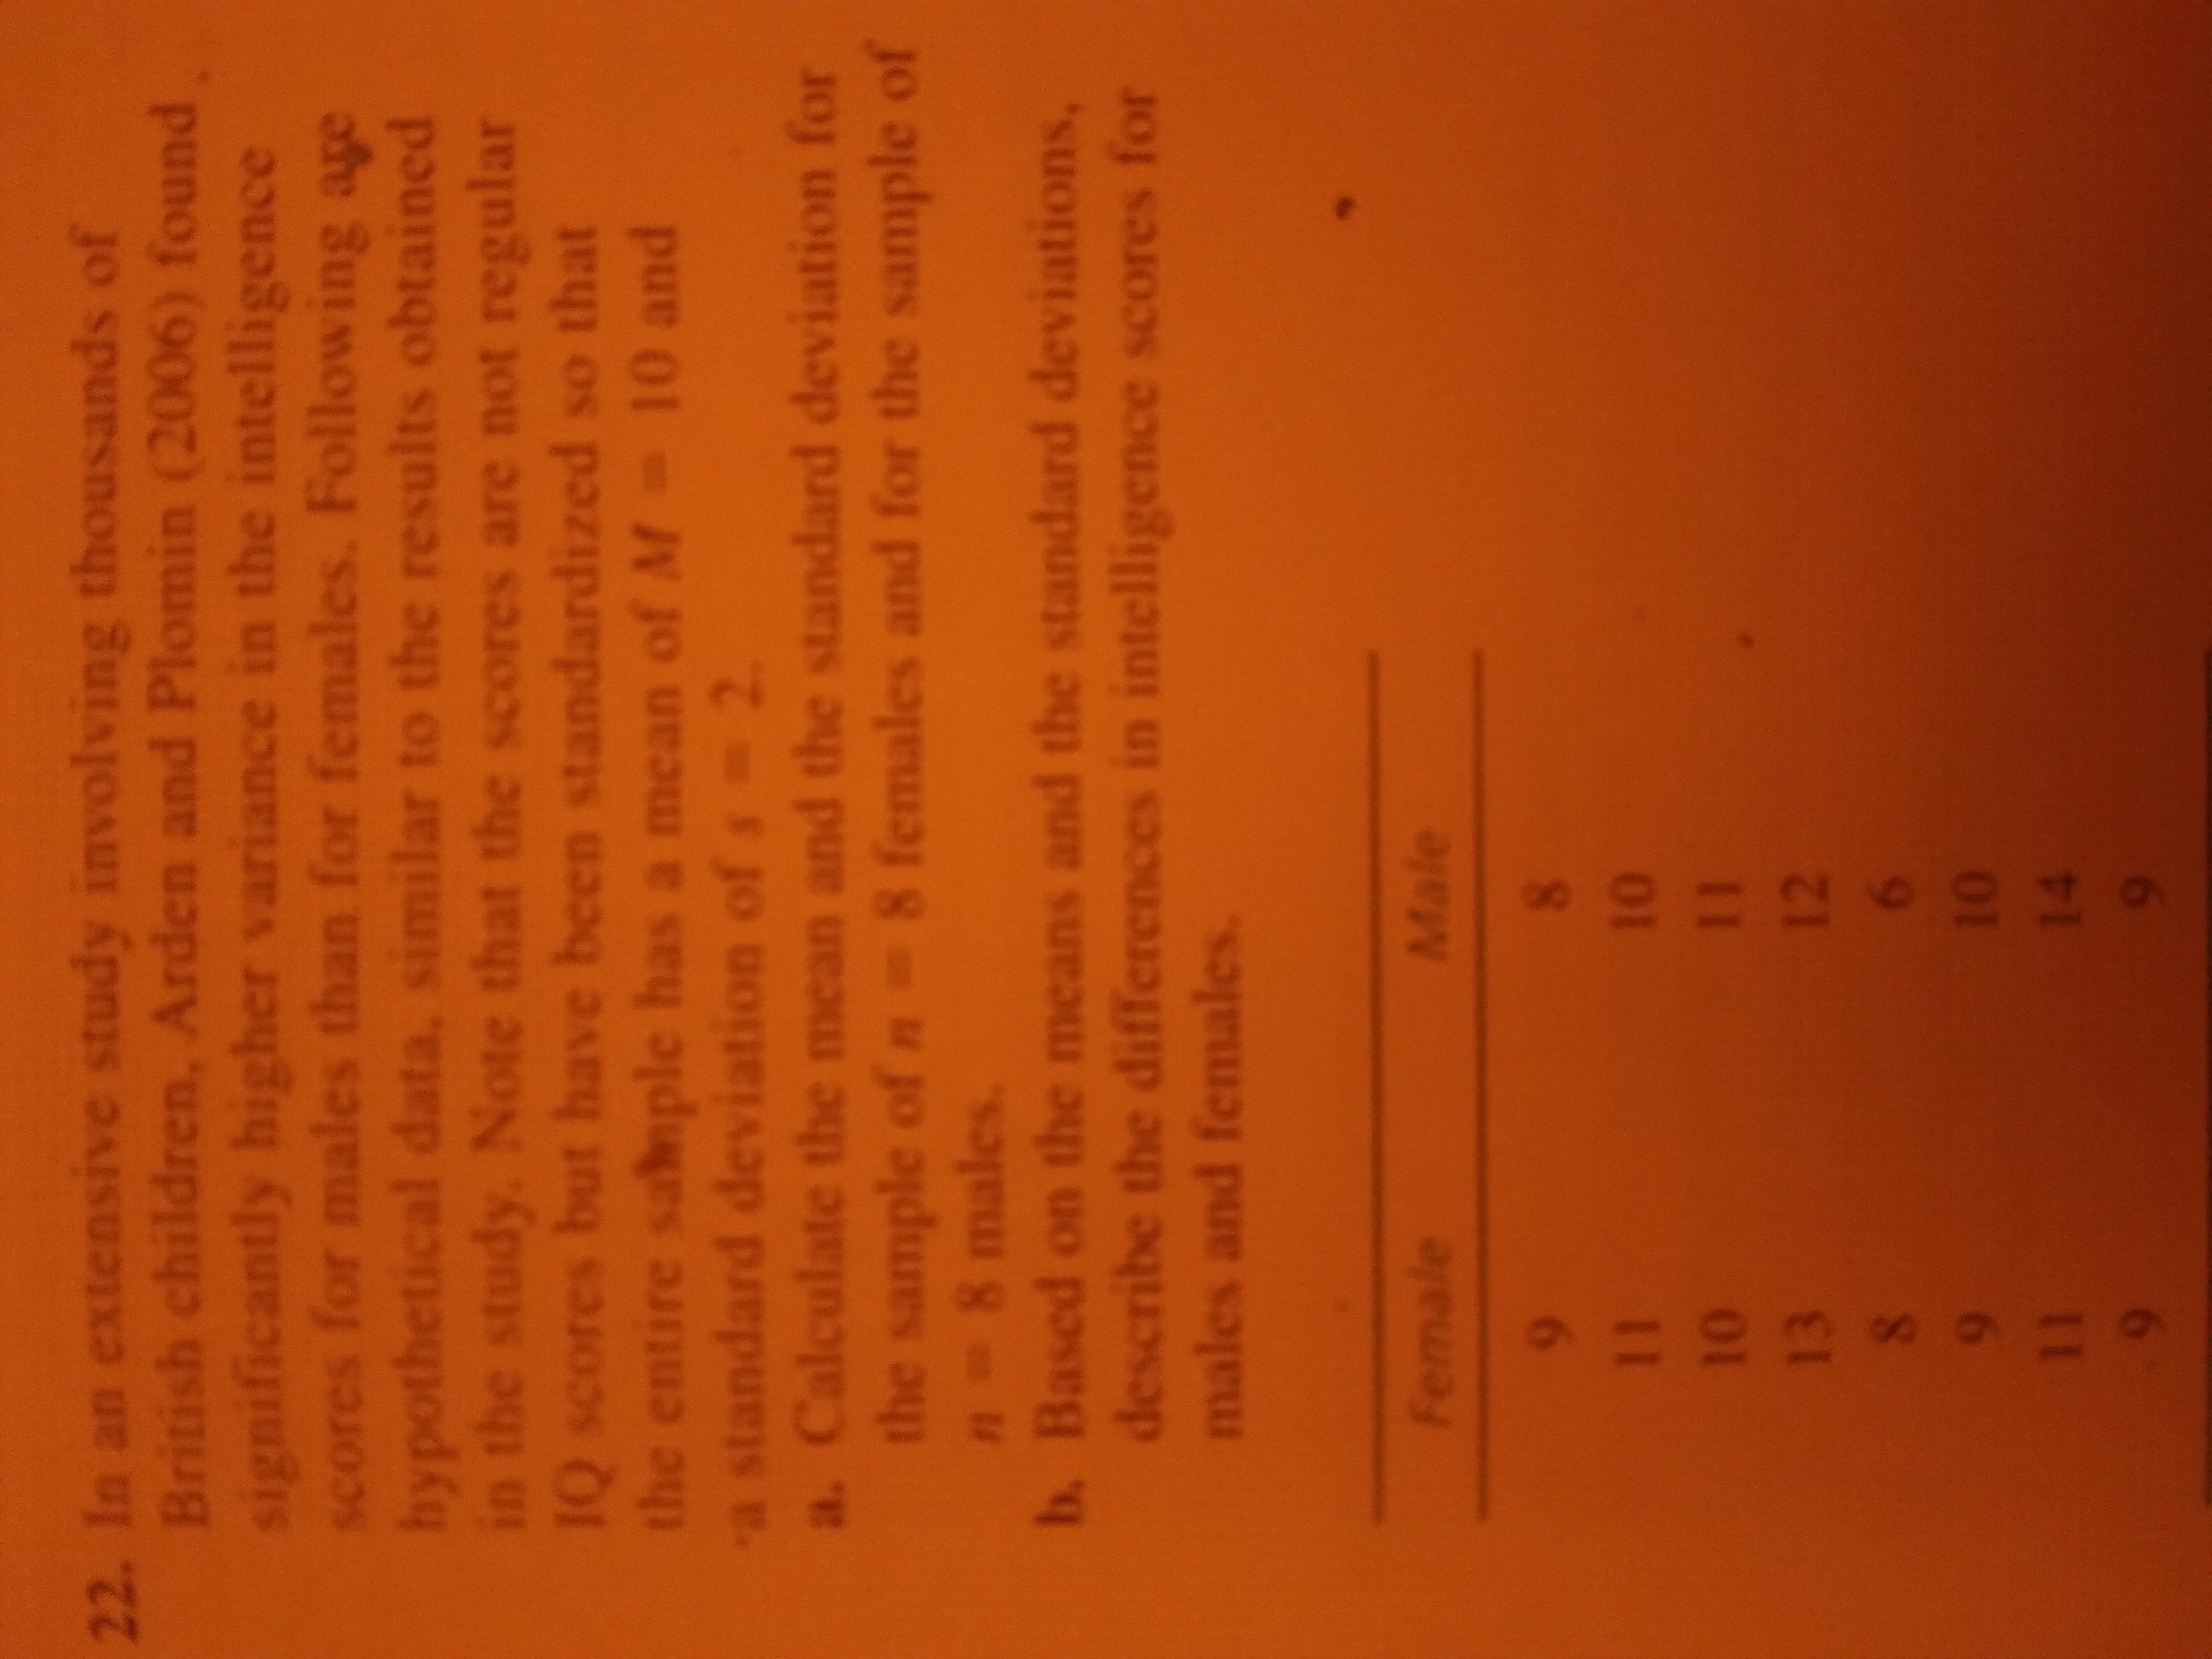

Transcribed Image Text:22. In an extensive study involving thousands of
British children, Arden and Plomin (2006) found
significantly higher variance in the intelligence
scores for males than for females. Following age
hypothetical data, similar to the results obtained
in the study. Note that the scores are not regular
1Q scores but have been standardized so that
the entire sabnple has a mean of M 10 and
a standard deviation of s 2.
a. Calculate the mean and the standard deviation for
the sample of n 8 females and for the sample of
n 8 males.
b. Based on the means and the standard deviations,
describe the differences in intelligence scores for
males and females.
Female
Male
6
11
01
01
13
11
12
8.
9
01
14
6
11
6
Expert Solution
This question has been solved!
Explore an expertly crafted, step-by-step solution for a thorough understanding of key concepts.

This is a popular solution

Trending nowThis is a popular solution!

Step by stepSolved in 3 steps with 2 images

Knowledge Booster

Similar questions
- Find the variance and the standard deviation for the following numbers: 1, 5, 6, 8. Show all your work. Do not simplify fractions/products/similar.arrow_forward3. Complete the first 3 columns of the table below. Values Deviations Square deviations X - X X (X-X)² Standard (z) scores X - X S Z= a. Compute the sample variance and sample standard deviation by definition. b. Fill in the last column of the table c. Compute the coefficient of variation.arrow_forwardDetermine the number of standard deviations from the mean (z-score). In the United States, the distribution of a male's height has a mean of 69 inches with a standard deviation of 3 inches. How many standard deviations from the mean is John Doe, who is 67 inches tall? Question 15 options: 0.67 standard deviations below the mean 0.33 standard deviations below the mean 2 standard deviations below the mean 1 standard deviation below the meanarrow_forward
- Consider the given data set. n = 12 measurements: 9, 8, 1, 5, 5, 7, 5, 6, 8, 7, 2, 0 Find the mean. USE SALT Find the standard deviation. (Round your answer to four decimal places.) z = Find the z-score corresponding to the minimum in the data set. (Round your answer to two decimal places.) Find the z-score corresponding to the maximum in the data set. (Round your answer to two decimal places.) z = Do the z-scores indicate that there are possible outliers in the data set? Since the z-score for the larger observation is larger than 2 in absolute value, the larger value is unusually large. Since both z-scores exceed 2 in absolute value, both of the observations are unusual. Since neither z-score exceeds 2 in absolute value, none of the observations are unusually small or large. Since the z-score for the smaller observation is larger than 2 in absolute value, the smaller value is unusually small.arrow_forwardUse the sample data set to evaluate each of the steps in determining the sample standard deviation 23 20 14 35 28 Give an exact answer, not an approximation, for each step except the standard deviation. round the standard deviation to the nearest hundredth.. = = variance, s2 = standard deviation, s =arrow_forwardThe frequency distribution was obtained using a class width of 0.5 for data on cigarette tax rates. Use the frequency distribution to approximate the population mean and population standard deviation. Compare these results to the actual mean u = $1.506 and standard deviation o = $1.004. Click the icon to view the frequency distribution for the tax rates. Frequency distribution of cigarette tax rates Tax Rate Frequency 0.00–0.49 7 0.50-0.99 14 1.00–1.49 7 1.50–1.99 2.00–2.49 5 2.50–2.99 5 3.00–3.49 3.50–3.99 1 4.00-4.49 1arrow_forward
- 3. Complete the first 3 columns of the table below. Values Deviations Square deviations X X - X (X-X)² Standard (z) scores X-X Z = a. Compute the sample variance and sample standard deviation by definition. b. Fill in the last column of the table c. Compute the coefficient of variation.arrow_forwardFind the range, the standard deviation, and the variance for the given samples. Round noninteger results to the nearest tenth. 91, 78, 89, 70, 90, 75, 84, 98, 96, 79, 77 range standard deviation variancearrow_forward
arrow_back_ios
arrow_forward_ios
Recommended textbooks for you
- MATLAB: An Introduction with ApplicationsStatisticsISBN:9781119256830Author:Amos GilatPublisher:John Wiley & Sons Inc
 Probability and Statistics for Engineering and th...StatisticsISBN:9781305251809Author:Jay L. DevorePublisher:Cengage Learning
 Statistics for The Behavioral Sciences (MindTap C...StatisticsISBN:9781305504912Author:Frederick J Gravetter, Larry B. WallnauPublisher:Cengage Learning
  Elementary Statistics: Picturing the World (7th E...StatisticsISBN:9780134683416Author:Ron Larson, Betsy FarberPublisher:PEARSON
 The Basic Practice of StatisticsStatisticsISBN:9781319042578Author:David S. Moore, William I. Notz, Michael A. FlignerPublisher:W. H. Freeman
 Introduction to the Practice of StatisticsStatisticsISBN:9781319013387Author:David S. Moore, George P. McCabe, Bruce A. CraigPublisher:W. H. Freeman
MATLAB: An Introduction with Applications
Statistics
ISBN:9781119256830
Author:Amos Gilat
Publisher:John Wiley & Sons Inc
Probability and Statistics for Engineering and th...
Statistics
ISBN:9781305251809
Author:Jay L. Devore
Publisher:Cengage Learning
Statistics for The Behavioral Sciences (MindTap C...
Statistics
ISBN:9781305504912
Author:Frederick J Gravetter, Larry B. Wallnau
Publisher:Cengage Learning
Elementary Statistics: Picturing the World (7th E...
Statistics
ISBN:9780134683416
Author:Ron Larson, Betsy Farber
Publisher:PEARSON
The Basic Practice of Statistics
Statistics
ISBN:9781319042578
Author:David S. Moore, William I. Notz, Michael A. Fligner
Publisher:W. H. Freeman
Introduction to the Practice of Statistics
Statistics
ISBN:9781319013387
Author:David S. Moore, George P. McCabe, Bruce A. Craig
Publisher:W. H. Freeman