
MATLAB: An Introduction with Applications
6th Edition
ISBN: 9781119256830
Author: Amos Gilat
Publisher: John Wiley & Sons Inc
expand_more
expand_more
format_list_bulleted
Related questions
Question
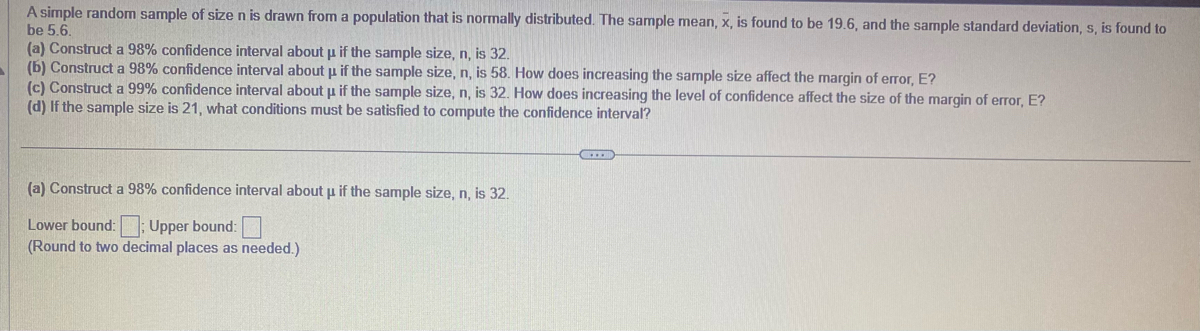

Transcribed Image Text:A simple random sample of size n is drawn from a population that is normally distributed. The sample mean, x, is found to be 19.6, and the sample standard deviation, s, is found to
be 5.6.
(a) Construct a 98% confidence interval about u if the sample size, n, is 32.
(b) Construct a 98% confidence interval about µ if the sample size, n, is 58. How does increasing the sample size affect the margin of error, E?
(c) Construct a 99% confidence interval about u if the sample size, n, is 32. How does increasing the level of confidence affect the size of the margin of error, E?
(d) If the sample size is 21, what conditions must be satisfied to compute the confidence interval?
(a) Construct a 98% confidence interval about µ if the sample size, n, is 32.
Lower bound:; Upper bound:
(Round to two decimal places as needed.)
C...
Expert Solution
This question has been solved!
Explore an expertly crafted, step-by-step solution for a thorough understanding of key concepts.

Step by stepSolved in 3 steps with 3 images

Knowledge Booster

Similar questions
- The law of large numbers states that as the number of observations drawn at random from a population with finite mean increases, the mean of the observed values: a. tends to get closer and closer to the population mean . b. gets smaller and smaller. c. gets larger and larger. d. fluctuates steadily between 1 standard deviation above and 1 standard deviation below the mean. I collect a random sample of size n from a population and compute a 95% confidence interval for the proportion I observe from the population. What could I do to produce a new confidence interval with a larger width (larger margin of error) based on these same data? a. I could use the same confidence level but compute the interval n times; approximately 5% of these intervals will be larger. b. Nothing can guarantee absolutely that I will get a larger interval; I can only say the chance of obtaining a larger interval is 0.05. c. I could use a smaller confidence…arrow_forwardA simple random sample of size n is drawn from a population that is normally distributed. The sample mean, x, is found to be 115, and the sample standard deviation, s, is found to be 10. (a) Construct an 80% confidence interval about μ if the sample size, n, is 25. (b) Construct an 80% confidence interval about μ if the sample size, n, is 12. (c) Construct a 70% confidence interval about μ if the sample size, n, is 25. (d) Could we have computed the confidence intervals in parts (a)-(c) if the population had not been normally distributed?arrow_forwardThe distribution of study times for first year students follows a Normal distribution with standard deviation σσ = 54 minutes. Suppose a sample of 487 students found that the mean study time for these students was x¯x¯= 173 minutes per week. Use this to find a 88.28% confidence interval to estimate the mean study time for all students. We are 88.28% confident that the mean study time for first year students is between minutes_____ and ____ minutes. What is the margin of error for your confidence interval?arrow_forward
- Professor Nord stated that the mean score on the final exam from all the years he has been teaching is a 79%. Colby was in his most recent class, and his class’s mean score on the final exam was 82%. Colby decided to run a hypothesis test to determine if the mean score of his class was significantly greater than the mean score of the population. α = .01. What is the mean score of the population? What is the mean score of the sample? Is this test one-tailed or two-tailed? Why?arrow_forwardA researcher is trying to estimate the population mean (μ) of anxiety based on his sample of n = 16 scores. His sample M = 58 and the s = 5.36. Construct the 95% confidence interval for μ.arrow_forwardA market surveyor wishes to know how many energy drinks teenagers drink each week. They want to construct a 80% confidence interval with an error of no more than 0.07 . A consultant has informed them that a previous study found the mean to be 3.6 energy drinks per week and found the variance to be 1.44 . What is the minimum sample size required to create the specified confidence interval? Round your answer up to the next integer.arrow_forward
- A simple random sample of size n is drawn from a population that is normally distributed. The sample mean, x, is found to be 110, and the sample standard deviation, s, is found to be 10. (a) Construct a 98% confidence interval about μ if the sample size, n, is 15. (b) Construct a 98% confidence interval about μ if the sample size, n, is 24. (c) Construct a 99% confidence interval about μ if the sample size, n, is 15. (d) Could we have computed the confidence intervals in parts (a)-(c) if the population had not been normally distributed?arrow_forwardAt a charter high school, the average GPA of a high school senior is known to be normally distributed. After a sample of 27 seniors is taken, the average GPA is found to be 2.85 and the sample variance is determined to be 0.16. Find a 95% confidence interval for the population mean GPA. a. 2.5615 to 2.8585 b. 2.6358 to 3.0642 c. 2.6917 to 3.0083 d. 2.5167 to 2.9033arrow_forwardA simple random sample of size n is drawn from a population that is normally distributed. The sample mean, x, is found to be 104, and the sample standard deviation, s, is found to be 8. (a) Construct a 95% confidence interval about u if the sample size, n, is 22. (b) Construct a 95% confidence interval about u if the sample size, n, is 16. (c) Construct a 90% confidence interval about u if the sample size, n, is 22. (d) Should the confidence intervals in parts (a)-(c) have been computed if the population had not been normally distributed? (a) Construct a 95% confidence interval about u if the sample size, n, is 22. Lower bound: 100.5; Upper bound: 107.5 (Round to one decimal place as needed.) (b) Construct a 95% confidence interval about u if the sample size, n, is 16. Lower bound: Upper bound: (Round to one decimal place as needed.)arrow_forward
arrow_back_ios
arrow_forward_ios
Recommended textbooks for you
- MATLAB: An Introduction with ApplicationsStatisticsISBN:9781119256830Author:Amos GilatPublisher:John Wiley & Sons Inc
 Probability and Statistics for Engineering and th...StatisticsISBN:9781305251809Author:Jay L. DevorePublisher:Cengage Learning
 Statistics for The Behavioral Sciences (MindTap C...StatisticsISBN:9781305504912Author:Frederick J Gravetter, Larry B. WallnauPublisher:Cengage Learning
  Elementary Statistics: Picturing the World (7th E...StatisticsISBN:9780134683416Author:Ron Larson, Betsy FarberPublisher:PEARSON
 The Basic Practice of StatisticsStatisticsISBN:9781319042578Author:David S. Moore, William I. Notz, Michael A. FlignerPublisher:W. H. Freeman
 Introduction to the Practice of StatisticsStatisticsISBN:9781319013387Author:David S. Moore, George P. McCabe, Bruce A. CraigPublisher:W. H. Freeman
MATLAB: An Introduction with Applications
Statistics
ISBN:9781119256830
Author:Amos Gilat
Publisher:John Wiley & Sons Inc
Probability and Statistics for Engineering and th...
Statistics
ISBN:9781305251809
Author:Jay L. Devore
Publisher:Cengage Learning
Statistics for The Behavioral Sciences (MindTap C...
Statistics
ISBN:9781305504912
Author:Frederick J Gravetter, Larry B. Wallnau
Publisher:Cengage Learning
Elementary Statistics: Picturing the World (7th E...
Statistics
ISBN:9780134683416
Author:Ron Larson, Betsy Farber
Publisher:PEARSON
The Basic Practice of Statistics
Statistics
ISBN:9781319042578
Author:David S. Moore, William I. Notz, Michael A. Fligner
Publisher:W. H. Freeman
Introduction to the Practice of Statistics
Statistics
ISBN:9781319013387
Author:David S. Moore, George P. McCabe, Bruce A. Craig
Publisher:W. H. Freeman