
MATLAB: An Introduction with Applications
6th Edition
ISBN: 9781119256830
Author: Amos Gilat
Publisher: John Wiley & Sons Inc
expand_more
expand_more
format_list_bulleted
Related questions
Topic Video
Question
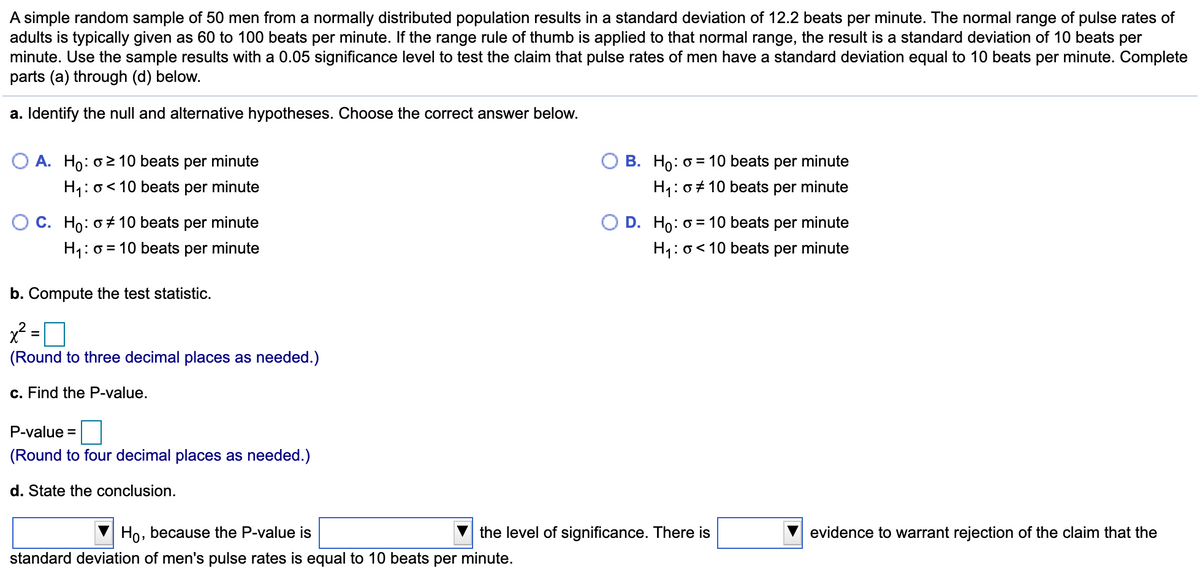

Transcribed Image Text:A simple random sample of 50 men from a normally distributed population results in a standard deviation of 12.2 beats per minute. The normal range of pulse rates of
adults is typically given as 60 to 100 beats per minute. If the range rule of thumb is applied to that normal range, the result is a standard deviation of 10 beats per
minute. Use the sample results with a 0.05 significance level to test the claim that pulse rates of men have a standard deviation equal to 10 beats per minute. Complete
parts (a) through (d) below.
a. Identify the null and alternative hypotheses. Choose the correct answer below.
O A. Ho: o 2 10 beats per minute
B. Ho: o = 10 beats per minute
H1: o< 10 beats per minute
H1: 0 + 10 beats per minute
O c. Ho: 0# 10 beats per minute
O D. Ho: o= 10 beats per minute
%3D
= 10 beats per minute
H: o< 10 beats per minute
b. Compute the test statistic.
%3D
(Round to three decimal places as needed.)
c. Find the P-value.
P-value =
(Round to four decimal places as needed.)
d. State the conclusion.
Ho, because the P-value is
the level of significance. There is
evidence to warrant rejection of the claim that the
standard deviation of men's pulse rates is equal to 10 beats per minute.
Expert Solution
This question has been solved!
Explore an expertly crafted, step-by-step solution for a thorough understanding of key concepts.

This is a popular solution

Trending nowThis is a popular solution!

Step by stepSolved in 5 steps with 1 images

Knowledge Booster


Learn more about
Need a deep-dive on the concept behind this application? Look no further. Learn more about this topic, statistics and related others by exploring similar questions and additional content below.Similar questions
- In the 1800s, German physician Carl Reinhold, took millions of axillary (i.e. armpit) temperatures from soldiers. This study established that body temperature is normally distributed and the standard normal human body temperature is 98.6°F with a standard deviation of 0.72 °F. In a recent study, American researchers obtained 5,000 axillary temperatures from a Los Angeles hospital. The mean of these temperature readings was 97.9 °F. Assuming a Type I error risk of no more than 5%, did the findings support the theory that human, body temperature has decreased since the 1800s? What is the Z crit?arrow_forwardIn a large section of a statistics class, the points for the final exam are normally distributed, with a mean of 74 and a standard deviation of 8. Grades are assigned such that the top 10% receive A's, the next 20% received B's, the middle 40% receive C's, the next 20% receive D's, and the bottom 10% receive F's. Find the lowest score on the final exam that would qualify a student for an A, a B, a C, and a D. The lowest score that would qualify a student for an A is nothing. (Round up to the nearest integer as needed.) The lowest score that would qualify a student for a B is nothing. (Round up to the nearest integer as needed.) The lowest score that would qualify a student for a C is nothing. (Round up to the nearest integer as needed.) The lowest score that would qualify a student for a D is nothing. (Round up to the nearest integer as needed.)arrow_forwardIt takes an average of 10.2 minutes for blood to begin clotting after an injury. An EMT wants to see if the average will decline if the patient is immediately told the truth about the injury. The EMT randomly selected 60 injured patients to immediately tell the truth about the injury and noticed that they averaged 10.1 minutes for their blood to begin clotting after their injury. Their standard deviation was 1.62 minutes. What can be concluded at the the a = 0.01 level of significance? a. For this study, we should use Select an answer b. The null and altemative hypotheses would be: Họ: Select an answer H1: ? Select an answer c. The test statistic (please show your answer to 3 decimal places.) d. The p-value = e. The p-value is (? va f. Based on this, we should Select an answer v the null hypothesis. g. Thus, the final conclusion is that .. (Please show your answer to 4 decimal places.) O The data suggest the population mean is not significantly less than 10.2 at a = 0.01, so there is…arrow_forward
- The standard deviation of pulse rates of adult males is less than 10 bpm. For a random sample of 144 adult males, the pulse rates have a standard deviation of 9.1 bpm. Find the value of the test statistic.arrow_forwardBlood pressure is distributed Normally, with a mean of 85 mm and a standard deviation of 20 mm. What fraction of the population has a blood pressure above 80 mm?arrow_forwardThe time to smoke fish is normally distributed with an average of 5.3 hours and a standard deviation of 2.1 hours. What is the z score for a fish that take 10 hours to smoke?arrow_forward
- In a large section of a statistics class, the points for the final exam are normally distributed, with a mean of 73 and a standard deviation of 8. Grades are assigned such that the top 10% receive A's, the next 20% received B's, the middle 40% receive C's, the next 20% receive D's, and the bottom 10% receive F's. Find the lowest score on the final exam that would qualify a student for an A, a B, a C, and a D. Click here to view Page 1 of the Standard Normal Table. Click here to view Page 2 of the Standard Normal Table. The lowest score that would qualify a student for an A is (Round up to the nearest integer as needed.)arrow_forwardIn a class with 50 students, a 60-item test is conducted. After the test, it is found that the mean of the scores is 40 and the standard deviation is 5. Assuming normal frequency distribution, determine the scores of the students within 1 standard deviation.arrow_forwardIn a large section of a statistics class, the points for the final exam are normally distributed, with a mean of 71and a standard deviation of 8. Grades are assigned such that the top 10% receive A's, the next 20% received B's, the middle 40% receive C's, the next 20% receive D's, and the bottom 10% receive F's. Find the lowest score on the final exam that would qualify a student for an A, a B, a C, and a D.arrow_forward
arrow_back_ios
arrow_forward_ios
Recommended textbooks for you
- MATLAB: An Introduction with ApplicationsStatisticsISBN:9781119256830Author:Amos GilatPublisher:John Wiley & Sons Inc
 Probability and Statistics for Engineering and th...StatisticsISBN:9781305251809Author:Jay L. DevorePublisher:Cengage Learning
 Statistics for The Behavioral Sciences (MindTap C...StatisticsISBN:9781305504912Author:Frederick J Gravetter, Larry B. WallnauPublisher:Cengage Learning
  Elementary Statistics: Picturing the World (7th E...StatisticsISBN:9780134683416Author:Ron Larson, Betsy FarberPublisher:PEARSON
 The Basic Practice of StatisticsStatisticsISBN:9781319042578Author:David S. Moore, William I. Notz, Michael A. FlignerPublisher:W. H. Freeman
 Introduction to the Practice of StatisticsStatisticsISBN:9781319013387Author:David S. Moore, George P. McCabe, Bruce A. CraigPublisher:W. H. Freeman
MATLAB: An Introduction with Applications
Statistics
ISBN:9781119256830
Author:Amos Gilat
Publisher:John Wiley & Sons Inc
Probability and Statistics for Engineering and th...
Statistics
ISBN:9781305251809
Author:Jay L. Devore
Publisher:Cengage Learning
Statistics for The Behavioral Sciences (MindTap C...
Statistics
ISBN:9781305504912
Author:Frederick J Gravetter, Larry B. Wallnau
Publisher:Cengage Learning
Elementary Statistics: Picturing the World (7th E...
Statistics
ISBN:9780134683416
Author:Ron Larson, Betsy Farber
Publisher:PEARSON
The Basic Practice of Statistics
Statistics
ISBN:9781319042578
Author:David S. Moore, William I. Notz, Michael A. Fligner
Publisher:W. H. Freeman
Introduction to the Practice of Statistics
Statistics
ISBN:9781319013387
Author:David S. Moore, George P. McCabe, Bruce A. Craig
Publisher:W. H. Freeman