
MATLAB: An Introduction with Applications
6th Edition
ISBN: 9781119256830
Author: Amos Gilat
Publisher: John Wiley & Sons Inc
expand_more
expand_more
format_list_bulleted
Related questions
Question
thumb_up100%
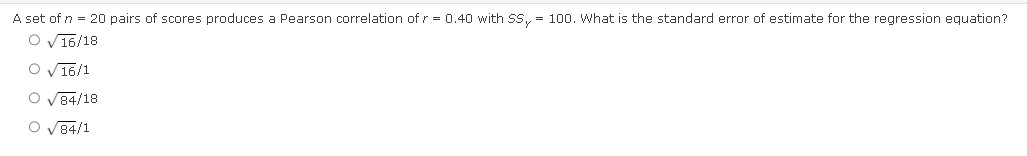

Transcribed Image Text:A set of n = 20 pairs of scores produces a Pearson correlation of r = 0.40 with SS, = 100. What is the standard error of estimate for the regression equation?
O√16/18
O √16/1
O √84/18
O √84/1
Expert Solution
This question has been solved!
Explore an expertly crafted, step-by-step solution for a thorough understanding of key concepts.

This is a popular solution

Trending nowThis is a popular solution!

Step by stepSolved in 2 steps

Knowledge Booster

Similar questions
- After performing a statistical regression on a set of data the value of the correlation coefficient r was -0.2041. What does that imply about the data?arrow_forwardWhat is the value of r2? Use the square root and your knowledge about the slope of the regression line to find the value of the correlation constant r. Based only on the value of r, do you think this line is useful for predicting life expectancy from the infant mortality rate? A new country called Arendelle has formed and has an infant mortality rate of 42 (deaths per 1000 live births). Use the equation of the regression line to predict the life expectancy for Arendelle. Round your answer to one decimal place. Another new country called Weselton has formed and has an infant mortality rate of 250 (deaths per 1000 live births). Recall some of the cautions we should take when considering correlation. In one or two complete sentences, explain why using the linear regression equation to make a life expectancy prediction is not a good idea for Weselton. If you had to choose exactly one potential influential outlier from the original data set, what would it be? Identify the point as an…arrow_forward49arrow_forward
- The regression line for the given data is = 6.91x + 46.26. Determine the residual of a data point for which x = 4 and y = 75.arrow_forwardListed below are systolic blood pressure measurements (in mm Hg) obtained from the same woman. Find the regression equation, letting the right arm blood pressure be the predictor (x) variable. Find the best predicted systolic blood pressure in the left arm given that the systolic blood pressure in the right arm is 85 mm Hg. Use a significance level of 0.05 Right Arm 101 100 94 75 Left Arm 174 167 146 144 Click the icon to view the critical values of the Pearson correlation coefficient r The regression equation is (Round to one decimal place as needed.) 76 144 CRITSarrow_forwardThe mall has a set of data with employee age (X) and the corresponding number of annual on-the-job-accidents(Y). Analysis on the set finds that the regression equation is Y=100-3X. What is the likely number of accidents for someone aged 30? 97 100 10 none of the abovearrow_forward
- The Toyota Camry is one of the best-selling cars in North America. The cost of a previously owned Camry depends upon many factors, including the model year, mileage, and condition. To investigate the relationship between the car's mileage and the sales price for a 2007 model year Camry, the following data show the mileage and sale price for 19 sales (PriceHub website). Click on the datafile logo to reference the data. DATA file 1. 18 Price ($1000s) 16 14 12 10 18 6 If your answer is zero, enter "0". a. Select a scatter diagram with the car mileage on the horizontal axis and the price on the vertical axis. 20 40 6,0 8,0 100 Miles (1000s) 120 223 +♡ ♡ Miles(1000s) 29 36 47 63 77 73 87 92 101 110 28 59 68 68 91 42 65 110 Price ($1000s) 16.2 16.0 13.8 11.5 12.5 12.9 11.2 13.0 11.8 10.8 8.3 12.5 11.1 15.0 12.2 13.0 15.6 12.7 8.3arrow_forwardc) Show that the coefficient of determination, R², can also be obtained as the squared correlation between actual Y values and the Y values estimated from the regression model where Y is the dependent variable. Note that the coefficient of correlation between Y and X is Eyixi r = And also that ỹ = ŷ (18.75)arrow_forwardThe average midterm score in a large statistics class was 60 with an SD of 5. The average final score in the same class was 80 with an SD of 15. The correlation coefficient between midterm and final scores was r=0.6. Using the regression line, we predict the final score of a student with a midterm score of 70 to be but this prediction is likely to be off by about Fill in the blanks, rounding each answer to one decimal point.arrow_forward
- A set of n = 25 pairs of scores (X and Y values) produces a regression equation Y = 3X – 2. Findthe predicted Y value for each of the following X scores: 0, 1, 3, -2.arrow_forwardThe following table gives the data for the hours students spent on homework and their grades on the first test. The equation of the regression line for this data is yˆ=43.097+1.15x. This equation is appropriate for making predictions at the 0.01 level of significance. If a student spent 32 hours on their homework, make a prediction for their grade on the first test. Round your prediction to the nearest whole number. Hours Spent on Homework and Test Grades Hours Spent on Homework 30 30 31 42 11 27 34 47 5 29 Grade on Test 83 75 75 96 45 76 97 85 53 75arrow_forwardA regression of the amount of calories in a serving of breakfast cereal vs. the amount of fat in the cereal gave the following results: Calories = 97.1053 + 9.6525*(grams of fat). Which of the following is FALSE: It is estimated that for every additional gram of fat in the cereal, the number of calories increases by about 9. It is estimated that in cereals with no fat, the total amount of calories is about 97. If a cereal has 2 g of fat, then it is estimated that the total number of calories is about 113. If a cereal has about 145 calories, then this equation indicates that it has about 5 grams of fat. One cereal has 140 calories and 5 g of fat. Its residual is about 5 cal.arrow_forward
arrow_back_ios
SEE MORE QUESTIONS
arrow_forward_ios
Recommended textbooks for you
- MATLAB: An Introduction with ApplicationsStatisticsISBN:9781119256830Author:Amos GilatPublisher:John Wiley & Sons Inc
 Probability and Statistics for Engineering and th...StatisticsISBN:9781305251809Author:Jay L. DevorePublisher:Cengage Learning
 Statistics for The Behavioral Sciences (MindTap C...StatisticsISBN:9781305504912Author:Frederick J Gravetter, Larry B. WallnauPublisher:Cengage Learning
  Elementary Statistics: Picturing the World (7th E...StatisticsISBN:9780134683416Author:Ron Larson, Betsy FarberPublisher:PEARSON
 The Basic Practice of StatisticsStatisticsISBN:9781319042578Author:David S. Moore, William I. Notz, Michael A. FlignerPublisher:W. H. Freeman
 Introduction to the Practice of StatisticsStatisticsISBN:9781319013387Author:David S. Moore, George P. McCabe, Bruce A. CraigPublisher:W. H. Freeman
MATLAB: An Introduction with Applications
Statistics
ISBN:9781119256830
Author:Amos Gilat
Publisher:John Wiley & Sons Inc
Probability and Statistics for Engineering and th...
Statistics
ISBN:9781305251809
Author:Jay L. Devore
Publisher:Cengage Learning
Statistics for The Behavioral Sciences (MindTap C...
Statistics
ISBN:9781305504912
Author:Frederick J Gravetter, Larry B. Wallnau
Publisher:Cengage Learning
Elementary Statistics: Picturing the World (7th E...
Statistics
ISBN:9780134683416
Author:Ron Larson, Betsy Farber
Publisher:PEARSON
The Basic Practice of Statistics
Statistics
ISBN:9781319042578
Author:David S. Moore, William I. Notz, Michael A. Fligner
Publisher:W. H. Freeman
Introduction to the Practice of Statistics
Statistics
ISBN:9781319013387
Author:David S. Moore, George P. McCabe, Bruce A. Craig
Publisher:W. H. Freeman