
MATLAB: An Introduction with Applications
6th Edition
ISBN: 9781119256830
Author: Amos Gilat
Publisher: John Wiley & Sons Inc
expand_more
expand_more
format_list_bulleted
Related questions
Question
thumb_up100%
For this question 2.16. The solution shows as attached. However, I followed excel steps and got same classes and bins but different frequencies. My instructor expects us to use PH STAT I believe. Is it because I didn’t run through PH STAT and instead used data analysis in excel? How do I use PH stat for this?

Transcribed Image Text:tion for these costs.
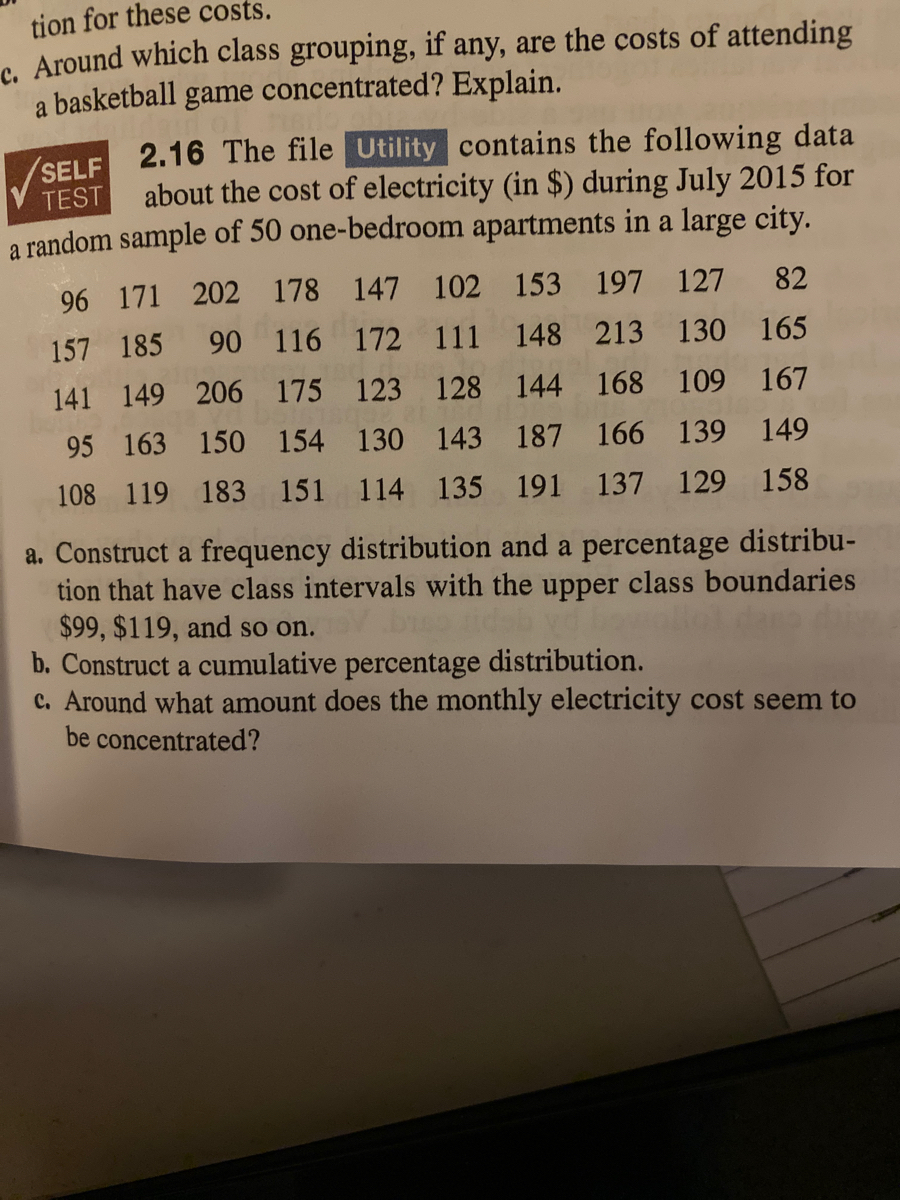
c. Around which class grouping, if any, are the costs of attending
a basketball
game
concentrated? Explain.
(SELF 2.16 The file Utility contains the following data
about the cost of electricity (in $) during July 2015 for
a random sample of 50 one-bedroom apartments in a large city.
TEST
96 171 202 178 147 102 153 197 127 82
157 185 90 116 172 111 148 213 130 165
141 149 206 175 123 128 144 168 109 167
95 163 150 154 130 143 187 166 139 149
108 119 183 151 114 135 191 137 129 158
a. Construct a frequency distribution and a percentage distribu-
tion that have class intervals with the upper class boundaries
$99, $119, and so on.
b. Construct a cumulative percentage distribution.
c. Around what amount does the monthly electricity cost seem to
be concentrated?

Transcribed Image Text:Solutions to End-of-Section and Cha
Electricity Costs
$80 to $99
$100 to $119
$120 to $139
$140 to $159
$160 to $179
$180 to $199
$200 to $219
Frequency
Percentage
8%
4
14
6.
13
18
26
18
10
Electricity Costs Frequency Percentage Cumulative %
8%
$99
4
8%
$119
7.
14%
22%
$139
9.
18%
40%
66%
S159
13
26%
S179
6.
18%
84%
$199
10%
94%
$219
6%
100%
The majority of utility charges are clustered between S120 and S1
1), (b) Annual Time Sitting in Traffic (hours)
Bin Cell
Frequency
Percentage
Cumu
15 but less than 20
3.23%
20 but less than 25
4.
12.90%
12.90%
25 but less than 30
4.
30 but less than 35
6.45%
amanm
Expert Solution
This question has been solved!
Explore an expertly crafted, step-by-step solution for a thorough understanding of key concepts.

This is a popular solution

Trending nowThis is a popular solution!

Step by stepSolved in 2 steps with 3 images

Knowledge Booster


Learn more about
Need a deep-dive on the concept behind this application? Look no further. Learn more about this topic, statistics and related others by exploring similar questions and additional content below.Similar questions
- just the last part thank youarrow_forwardUsing a TI-84 Plus calculator, I need to know the step by step process to calculate these. I don’t need these just written out on paper, but I also need to be shown the every move made into the calculator. Like, ‘STAT’ then ‘TESTS’ then ‘2: T-Test’, and so on.arrow_forwardPlease help with this problem. Can you please explain using a calculator. Thank you.arrow_forward
- Suppose the mean of X is 94. What does the mean of X become if you multiply X by 1.22? (Use two decimal places, ex: 12.34)arrow_forwardFor a 4-unit class like Statistics, students should spend average of 12 hours studying for the class. A survey was done on 22 students, and the distribution of total study hours per week is bell-shaped with a mean of 12 hours and a standard deviation of 2.8 hours. Use the Empirical Rule to answer the following questions. a) 68% of the students spend between 9.215 on Statistics each week. Xhours and 14.785 hours b) 95% of the students spend between 6.512 X hours and 6.512 X hours on Statistics each week. c) 99.7% of the students spend between 20.288 x hours and 20.288 x hours on Statistics each week.arrow_forward
arrow_back_ios
arrow_forward_ios
Recommended textbooks for you
- MATLAB: An Introduction with ApplicationsStatisticsISBN:9781119256830Author:Amos GilatPublisher:John Wiley & Sons Inc
 Probability and Statistics for Engineering and th...StatisticsISBN:9781305251809Author:Jay L. DevorePublisher:Cengage Learning
 Statistics for The Behavioral Sciences (MindTap C...StatisticsISBN:9781305504912Author:Frederick J Gravetter, Larry B. WallnauPublisher:Cengage Learning
  Elementary Statistics: Picturing the World (7th E...StatisticsISBN:9780134683416Author:Ron Larson, Betsy FarberPublisher:PEARSON
 The Basic Practice of StatisticsStatisticsISBN:9781319042578Author:David S. Moore, William I. Notz, Michael A. FlignerPublisher:W. H. Freeman
 Introduction to the Practice of StatisticsStatisticsISBN:9781319013387Author:David S. Moore, George P. McCabe, Bruce A. CraigPublisher:W. H. Freeman
MATLAB: An Introduction with Applications
Statistics
ISBN:9781119256830
Author:Amos Gilat
Publisher:John Wiley & Sons Inc
Probability and Statistics for Engineering and th...
Statistics
ISBN:9781305251809
Author:Jay L. Devore
Publisher:Cengage Learning
Statistics for The Behavioral Sciences (MindTap C...
Statistics
ISBN:9781305504912
Author:Frederick J Gravetter, Larry B. Wallnau
Publisher:Cengage Learning
Elementary Statistics: Picturing the World (7th E...
Statistics
ISBN:9780134683416
Author:Ron Larson, Betsy Farber
Publisher:PEARSON
The Basic Practice of Statistics
Statistics
ISBN:9781319042578
Author:David S. Moore, William I. Notz, Michael A. Fligner
Publisher:W. H. Freeman
Introduction to the Practice of Statistics
Statistics
ISBN:9781319013387
Author:David S. Moore, George P. McCabe, Bruce A. Craig
Publisher:W. H. Freeman