MATLAB: An Introduction with Applications
6th Edition
ISBN: 9781119256830
Author: Amos Gilat
Publisher: John Wiley & Sons Inc
expand_more
expand_more
format_list_bulleted
Concept explainers
Question
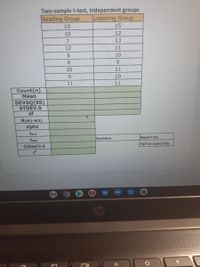
A school psychologist is interested in determining if children with attention deficit hyperactivity disorder (ADHD) learn better if English literature is read to them rather than having them read the material alone by themselves. A random sample of 10 sixth graders with ADHD is selected and divided into two groups of n=9. One of the groups has a story read to them (Listening Group) and the other reads the story alone by themselves (Reading Group). A test on the story is given after each group has finished reading or hearing the story. The following scores were obtained with 20 being a perfect score.
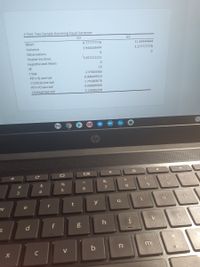
What is the t-statistic?

Transcribed Image Text:t-Test: Two-Sample Assuming Equal Variances
G1
G2
Mean
8.777777778
11.44444444
Variance
3.944444444
3.277777778
Observations
9
9
Pooled Variance
3.611111111
Hypothesized Mean
df
16
t Stat
-2.97683363
P(T<=t) one-tail
t Critical one-tail
0.004449553
1.745883676
P(T<=t) two-tail
t Critical two-tail
0.008899105
2.119905299
&
#
$
%
8
6.
3
4
y
e
r
d
b
n.
m
C
V
この

Transcribed Image Text:Two-sample t-test, independent groups
Reading Group
Listening Group
10
15
10
12
13
12
11
8
10
8.
6.
10
11
6.
10
11
11
Count(n)
Mean
(SS)
STDEV.S
df
DEV
S(M1-M2)
alpha
tcrit
Reject Ho
Fail to reject Ho
Decision
tobs
Cohen's d
Expert Solution
This question has been solved!
Explore an expertly crafted, step-by-step solution for a thorough understanding of key concepts.
Step by stepSolved in 2 steps

Knowledge Booster
Learn more about
Need a deep-dive on the concept behind this application? Look no further. Learn more about this topic, statistics and related others by exploring similar questions and additional content below.Similar questions
- The Bureau of Labor Statistics reports that the official unemployment rate for Black people was 10.4% and 4.7% for White people in February 2015. Select all correct answers for this question. O The samples of white and black people are independent. The explanatory variable is the unemployment rate. The response variable is the unemployment rate. The response variable is race.arrow_forwardTo investigate how people communicate over the internet, a researcher had subjects write messages in an online forum. She split her sample of 76 participants into young adults and older adults based on their age. She then compared how many emojis and emoticons the young adults used in their messages compared to the older adults. What is the best test to analyze the results of this study? One Sampe Z Test One Sample t Test Independent Samples t Test Dependent Samples t Testarrow_forwardA report describes a survey of 251 adult Americans. Participants in the survey were asked how often they disinfect their phone and were asked to respond with one of the following categories: more than once a week, once a week, every other, week, every three weeks, or less often than every three weeks. For this group, 9% responded more than once a week, 52% responded once a week, 26% responded every other week, 6% responded every three weeks, and 7% responded less often than every three weeks. Fill in the table below with the relative frequency distributions. How Often? Relative Frequency More than once a week Once a week Every other week Every three weeks Less often than every three weeksarrow_forward
- would this be a one tail or two tail test?arrow_forwardIn a study about learning styles, researchers used a group of 64 elementary school students who volunteered to be part of the study. The researchers gave each student a pre-test and based upon the results, they divided them into 32 pairs of similarly scoring students. School administrators then randomly assigned one student from each pair to mathematics instruction online while the other student received in-person instruction in a traditional classroom. At the end of the year, all 64 students received a mathematics assessment, measured on a 100-point scale. The researchers calculated the difference (in person −− online) in the mathematics assessment scores for each pair of students. The 32 differences had a mean of 15 and a standard deviation of 3.9 points. Construct and interpret a 95% confidence interval for the mean difference (in person −− online) in the mathematics assessment scores for all pairs of students like these who learn math either face-to-face or online.arrow_forwardA tv report conducted a survey of 681 people in Washington state and found that 26% of the population believe that Mt Saint Helen's will have a repeat eruption this year. In the accompanying dialogue, the reporter states, we are 91% confident that the true proportion of people in Washington state who believe that Mt saint Helen's wil have a repeat eruption this year lies between 20% and 32%. What does 91% represent in the report?arrow_forward
- A high school track coach wanted to test whether giving the students an energy drink could affect performance during the 100 meter race. The coach split the 26 boys into two equal sized groups, where Group 1 was given the energy drink and Group 2 was not. The 100 meter race times were recorded during practice and shown in the table below. What inference can be made about the results? Group 1 Group 2 12.2 13 12.5 12.3 13.3 12.8 12.9 13 13 13.8 12.1 13 13 13 13 13 12.1 13 13 13 12.1 13 12.8 13 13 12.6 Mean: 12.7 Mean: 13 Since the simulation shows ( many cases or free cases )? where a mean difference of ( solve for this answer ) or less occurred when the groups were re-randomized, it can be inferred that the mean difference observed in the study was ( very possibly or very unlikely ) ?due to the random assignment of participants into groups, so the results of the study are (…arrow_forwardMaddie conducts a study to see if listening to music helps students learn math. She surveys a random sample of 250 college sophomores who completed a math class within the past six months. She asks them to indicate how frequently they listened to music while studying math. The students also report their final grade in the math class at the end of the semester. Select the statement below that is false. There is no placebo in this study. Maddie conducted an observational study. A confounding variable could be how often the participants studied math. The population Maddie studied was 250 college sophomores.arrow_forwardCraik & Tulving ran an experiment to determine how depth of processing during study affects memory. In the study phase, 12 participants made judgments about words. In one block of trials (the visual condition) they indicated whether the words were written in upper case or lower case; in another block of trials (the auditory condition) they indicated whether the words contained an "ee" sound; in another block of trials (the meaning condition) they indicated whether the meaning of the words was pleasant or unpleasant. There were 12 words in each block. After completing the study phase, participants were asked to write down all the words they could remember. Here are the data: Mean Visual 3.5 Auditory 4.5 Meaning 6.0 Standard Deviation 1.5 1.6 1.9 Compared to the within-subjects design, the between-subjects design (select all that apply) Oa. Would have less statistical power O b. Would be less prone to experimenter bias O c. Would be less prone to order effects Od. Would have better…arrow_forward
arrow_back_ios
arrow_forward_ios
Recommended textbooks for you
 MATLAB: An Introduction with ApplicationsStatisticsISBN:9781119256830Author:Amos GilatPublisher:John Wiley & Sons Inc
 Probability and Statistics for Engineering and th...StatisticsISBN:9781305251809Author:Jay L. DevorePublisher:Cengage Learning
 Statistics for The Behavioral Sciences (MindTap C...StatisticsISBN:9781305504912Author:Frederick J Gravetter, Larry B. WallnauPublisher:Cengage Learning
 Elementary Statistics: Picturing the World (7th E...StatisticsISBN:9780134683416Author:Ron Larson, Betsy FarberPublisher:PEARSON
 The Basic Practice of StatisticsStatisticsISBN:9781319042578Author:David S. Moore, William I. Notz, Michael A. FlignerPublisher:W. H. Freeman
 Introduction to the Practice of StatisticsStatisticsISBN:9781319013387Author:David S. Moore, George P. McCabe, Bruce A. CraigPublisher:W. H. Freeman

MATLAB: An Introduction with Applications
Statistics
ISBN:9781119256830
Author:Amos Gilat
Publisher:John Wiley & Sons Inc

Probability and Statistics for Engineering and th...
Statistics
ISBN:9781305251809
Author:Jay L. Devore
Publisher:Cengage Learning

Statistics for The Behavioral Sciences (MindTap C...
Statistics
ISBN:9781305504912
Author:Frederick J Gravetter, Larry B. Wallnau
Publisher:Cengage Learning

Elementary Statistics: Picturing the World (7th E...
Statistics
ISBN:9780134683416
Author:Ron Larson, Betsy Farber
Publisher:PEARSON

The Basic Practice of Statistics
Statistics
ISBN:9781319042578
Author:David S. Moore, William I. Notz, Michael A. Fligner
Publisher:W. H. Freeman

Introduction to the Practice of Statistics
Statistics
ISBN:9781319013387
Author:David S. Moore, George P. McCabe, Bruce A. Craig
Publisher:W. H. Freeman