
MATLAB: An Introduction with Applications
6th Edition
ISBN: 9781119256830
Author: Amos Gilat
Publisher: John Wiley & Sons Inc
expand_more
expand_more
format_list_bulleted
Related questions
Concept explainers
Question
A school psychologist is interested in determining if children with attention deficit hyperactivity disorder (ADHD) learn better if English literature is read to them rather than having them read the material alone by themselves. A random sample of 10 sixth graders with ADHD is selected and divided into two groups of n=9. One of the groups has a story read to them (Listening Group) and the other reads the story alone by themselves (Reading Group). A test on the story is given after each group has finished reading or hearing the story. The following scores were obtained with 20 being a perfect score.
What is the alpha level?
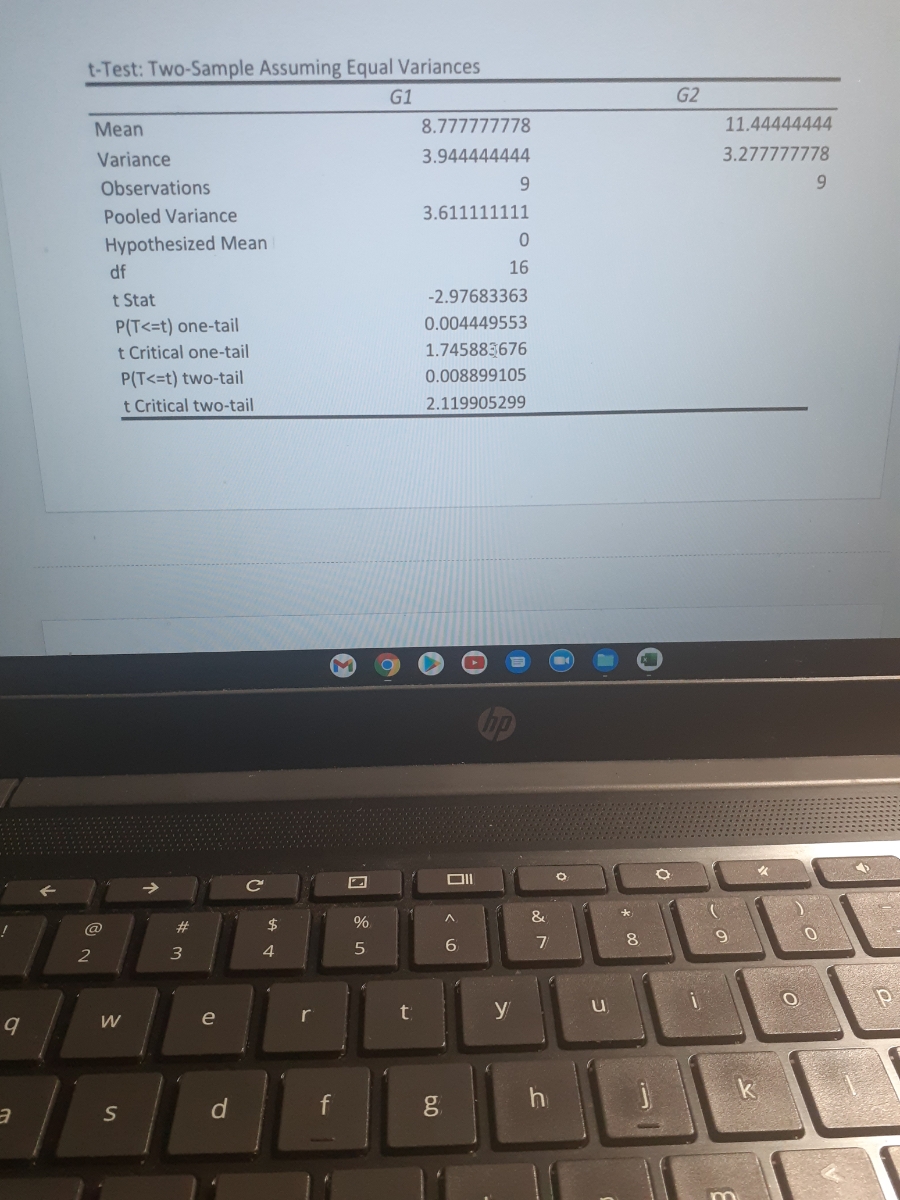

Transcribed Image Text:t-Test: Two-Sample Assuming Equal Variances
G1
G2
Mean
8.777777778
11.44444444
Variance
3.944444444
3.277777778
Observations
9.
9.
Pooled Variance
3.611111111
Hypothesized Mean
df
16
t Stat
-2.97683363
P(T<=t) one-tail
0.004449553
t Critical one-tail
1.745883676
P(T<=t) two-tail
t Critical two-tail
0.008899105
2.119905299
@
#
24
8.
9.
6.
2
y
u
W
e
h

Transcribed Image Text:Two-sample t-test, independent groups
Reading Group
Listening Group
10
15
10
12
7
13
12
11
8
10
9.
10
11
9.
10
11
11
Count(n)
Mean
DEVSQ(SS)
STDEV.S
df
S(M1-M2)
alpha
tcrit
Reject Ho
Fail to reject Ho
tobs
Decision
Cohen's d
&
@
23
$
%
6
8
3.
4
r
y
e
h
k
f
n.
m
C
V
6.0
Expert Solution
This question has been solved!
Explore an expertly crafted, step-by-step solution for a thorough understanding of key concepts.

This is a popular solution

Trending nowThis is a popular solution!

Step by stepSolved in 2 steps with 1 images

Knowledge Booster


Learn more about
Need a deep-dive on the concept behind this application? Look no further. Learn more about this topic, statistics and related others by exploring similar questions and additional content below.Similar questions
- In a survey of 1220 adults in a country, 58% said the country's leader should release all medical information that might affect their ability to serve. The study is observational, an experiment, because it applies does not apply a treatment to the adults.arrow_forwardA researcher conducts an experiment to test whether memory changes with age. They recruited 24 participants separated into four age groups. The groups differ according to the age of subjects. In group one, all participants are 30 years old. Group 2, 40 years old. Group 3, 50 years old. And group 4, 60 years old. Assume that the participants are all in good health and that the groups are matched on other important variables such as years of education, IQ, gender, motivation, and so on. Each participant is shown a series of nonsense syllables ( a meaningless combination of three letters such as Daf or FUM ) at a rate of one syllable every four seconds. The series is shown twice, after which participants are asked to write down as many of the syllables as they can remember. Below is number of syllables remembered by each participant. 30 years old 14 13 15 17 12 10 40 years old 12 15 16 11 12 18 50 years old 17 14 14 9 13 15 60 years old 13 10 7 8 6 9 what is the alternative and null…arrow_forwardIn 2014, Scotland was considering independence from England, going so far as to take a referendum vote. One opinion poll taken at the time showed that 51% of Scots favored "independence." In another poll taken at that same time, only 34% favored being "separate" from England. The primary reason these results differed by so much is that a. samples will usually differ just by chance due to random sampling. b. the wording of questions has a big effect on poll results. c. more follow-up efforts reduced the nonresponse rate of the second poll. d. the sample sizes are different, so the margins of error are different.arrow_forward
- A statistics student at Pleasantville High School (PHS) looked at seat belt use by drivers. Customers were observed driving into a local convenience store. After the drivers left their cars, the student asked each driver several questions about seat belt use. In all, 80% of the drivers said that they always use seat belts. However, the student observed that only 61.5% of these same drivers were actually wearing a seat belt when they pulled into the store parking lot. Which of the following best explains the difference in the two percentages? (A) The difference is due to sampling variability. We shouldn't expect the results of a sample to match the truth about the population every time. (B) The difference is due to response bias. Drivers who don't use seat belts are likely to lie and say they do use seat belts. (C) The difference is due to undercoverage bias. The study included only customers of the convenience store and did not include all drivers in the population. (D) The difference…arrow_forwardThe Bureau of Labor Statistics reports that the official unemployment rate for Black people was 10.4% and 4.7% for White people in February 2015. Select all correct answers for this question. O The samples of white and black people are independent. The explanatory variable is the unemployment rate. The response variable is the unemployment rate. The response variable is race.arrow_forwardTwo different blood pressure medicines are being compared to determine if the average reduction in blood pressure is the same for each medication. The goal of the study is to determine if the medications differ. Twenty men age 50-60 years old are selected for the study. Ten men are chosen at random to receive the first medication and the other 10 men receive the second medication. Each of the 20 men is monitored for one month to determine the change in blood pressure over that time. Minitab provides the 95% confidence interval for (mu1 - mu2) (2.63, 14.18) a. Interpret this 95% CI. b. What assumptions (be specific) are necessary to construct this CI?arrow_forward
- A team of researchers would like to determine whether the number of households that use the internet for more than an hour a day is greater in large cities or small towns. To do so, the researchers take two random samples. The first sample consists of randomly selected people who live in cities with more than 500,000 people around the country. The second sample consists of randomly selected people who live in towns with fewer than 20,000 people. Are these samples dependent or independent? Select the correct answer below: O These samples are independent. O These samples are dependent. Not enough information is provided to determine independence.arrow_forwardIt is believed that 11% of all Americans are left-handed. A college needs to know how many left-handed desks to place in the big lecture halls being constructed on its campus. In a random sample of 340 students from that college, whether or not a student was left-handed was recorded for each student. The college wants to know if the data provide enough evidence to show that students at this college have a different percentage of left- handers than the general American population? State the random variable, population parameter, and hypotheses. State the Type I and Type II errors in the context of this problem. a) The symbol for the random variable involved in this problem is ? ✓ The wording for the random variable in context is as follows: Select an answer b) The symbol for the parameter involved in this problem is The wording for the parameter in context is as follows: Select an answer c) Fill in the correct null and alternative hypotheses: Ho?? ✓ HA: ? ✓ ? ✓ d) A Type I error in the…arrow_forwardA team of researchers is interested in the effect on physical health of writing about thoughts and feelings associated with traumatic life events (expressive writing). The researchers recruit 30 undergraduate students to take part in the study and randomly assign them to be in an expressive writing group or a control group. Students in the expressive writing group are instructed to write four 20 - minute essays over four consecutive days about their most traumatic life experiences. Students in the control group write four 20 – minute essays over consecutive days describing their plans for that day. One week later, the researchers ask the students to rate their overall level of physical health (on a scale 0 = very poor health, to 100 = perfect health). EWG: 75, 86, 77, 91, 68, 74, 62, 93, 82, 79, 94, 56, 79, 86, 90, 97 CWG: 81, 76, 71, 70, 62, 50, 58, 63, 76, 64, 65, 72, 52, 59 The researchers were interested in identifying a positive or a negative health effect of expressive writing.…arrow_forward
- A hearing specialist conducts a study on hearing loss at certain frequencies among a group of patients in a retirement community. Of 94 residents tested, 10 had significant hearing loss at low frequencies but not high, 40 had a significant loss at high frequencies but not low, and 26 showed no significant hearing loss at all. How many residents had hearing loss at both low and high frequencies?arrow_forwardThe authors of a research article were interested in the effect on female viewers of watching movies in which female heroines were portrayed in roles that focus on their sex appeal. They carried out an experiment in which female college students were assigned at random to one of two experimental groups. The 24 women in one group watched 13 minutes of scenes from a certain superhero film series and then responded to a questionnaire designed to measure body esteem. Lower scores on this measure correspond to lower body satisfaction. The 29 women in the other group (the control group) did not watch any video prior to responding to the questionnaire measuring body esteem. For the women who watched the video, the mean body esteem score was 4.44 and the standard deviation was 1.02. For the women in the control group, the mean body esteem score was 5.07 and the standard deviation was 0.96. For purposes of this exercise, you may assume that the distribution of body esteem scores for each of the…arrow_forwardIt is believed that 11% of all Americans are left-handed. A college needs to know how many left-handed desks to place in the big lecture halls being constructed on its campus. In a random sample of 210 students from that college, whether or not a student was left-handed was recorded for each student. The college wants to know if the data provide enough evidence to show that students at this college have a different percentage of left-handers than the general American population? State the random variable, population parameter, and hypotheses. State the Type I and Type II errors in the context of this problem.a) The symbol for the random variable involved in this problem is The wording for the random variable in context is as follows: b) The symbol for the parameter involved in this problem is The wording for the parameter in context is as follows: c) Fill in the correct null and alternative hypotheses: H0:H0: HA:HA:…arrow_forward
arrow_back_ios
SEE MORE QUESTIONS
arrow_forward_ios
Recommended textbooks for you
- MATLAB: An Introduction with ApplicationsStatisticsISBN:9781119256830Author:Amos GilatPublisher:John Wiley & Sons Inc
 Probability and Statistics for Engineering and th...StatisticsISBN:9781305251809Author:Jay L. DevorePublisher:Cengage Learning
 Statistics for The Behavioral Sciences (MindTap C...StatisticsISBN:9781305504912Author:Frederick J Gravetter, Larry B. WallnauPublisher:Cengage Learning
  Elementary Statistics: Picturing the World (7th E...StatisticsISBN:9780134683416Author:Ron Larson, Betsy FarberPublisher:PEARSON
 The Basic Practice of StatisticsStatisticsISBN:9781319042578Author:David S. Moore, William I. Notz, Michael A. FlignerPublisher:W. H. Freeman
 Introduction to the Practice of StatisticsStatisticsISBN:9781319013387Author:David S. Moore, George P. McCabe, Bruce A. CraigPublisher:W. H. Freeman
MATLAB: An Introduction with Applications
Statistics
ISBN:9781119256830
Author:Amos Gilat
Publisher:John Wiley & Sons Inc
Probability and Statistics for Engineering and th...
Statistics
ISBN:9781305251809
Author:Jay L. Devore
Publisher:Cengage Learning
Statistics for The Behavioral Sciences (MindTap C...
Statistics
ISBN:9781305504912
Author:Frederick J Gravetter, Larry B. Wallnau
Publisher:Cengage Learning
Elementary Statistics: Picturing the World (7th E...
Statistics
ISBN:9780134683416
Author:Ron Larson, Betsy Farber
Publisher:PEARSON
The Basic Practice of Statistics
Statistics
ISBN:9781319042578
Author:David S. Moore, William I. Notz, Michael A. Fligner
Publisher:W. H. Freeman
Introduction to the Practice of Statistics
Statistics
ISBN:9781319013387
Author:David S. Moore, George P. McCabe, Bruce A. Craig
Publisher:W. H. Freeman