
MATLAB: An Introduction with Applications
6th Edition
ISBN: 9781119256830
Author: Amos Gilat
Publisher: John Wiley & Sons Inc
expand_more
expand_more
format_list_bulleted
Related questions
Topic Video
Question
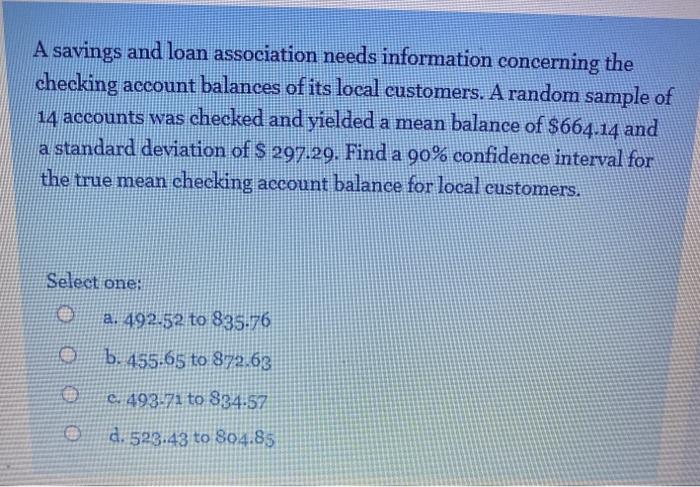

Transcribed Image Text:A savings and loan association needs information concerning the
checking account balances of its local customers. A random sample of
14 accounts was checked and yielded a mean balance of $664.14 and
a standard deviation of S 297.29. Find a 90% confidence interval for
the true mean checking account balance for local customers.
Select one:
a. 492.52 to 835.76
b. 455-65 to 872.63
C. 493-71 to 834-57
d. 523.43 to 804.85
Expert Solution
This question has been solved!
Explore an expertly crafted, step-by-step solution for a thorough understanding of key concepts.

This is a popular solution

Trending nowThis is a popular solution!

Step by stepSolved in 2 steps with 2 images

Knowledge Booster


Learn more about
Need a deep-dive on the concept behind this application? Look no further. Learn more about this topic, statistics and related others by exploring similar questions and additional content below.Similar questions
- The America Automobile Association reported that the mean price of a gallon of regular grade gasoline in the United States in October 2020 was $2.82. An economist is interested in determining whether the mean price of regular grade gasoline is cheaper (less than) in New York State. To test this, the economist sample 50 gas stations in NY and find the mean price of regular grade gasoline to be $2.77. Assume the standard deviation for the price of regular grade gasoline is $0.15. Use the critical value method to perform a hypothesis test at the 0.05 level of significance. a. Define the parameter we are testing and setup a hypothesis test to see if the mean price of gas is cheaper in NY compared to the national mean: b. Calculate the test statistics for this hypothesis test. c.What is the critical value for this hypothesis test?arrow_forwardA new small business wants to know if its current radio advertising is effective. The owners decide to look at the mean number of customers who make a purchase in the store on days immediately following days when the radio ads are played as compared to the mean for those days following days when no radio advertisements are played. They found that for 10 days following no advertisements, the mean was 18.3 purchasing customers with a standard deviation of 1.8 customers. On 7 days following advertising, the mean was 19.4 purchasing customers with a standard deviation of 1.6 customers. Test the claim, at the 0.02 level, that the mean number of customers who make a purchase in the store is lower for days following no advertising compared to days following advertising. Assume that both populations are approximately normal and that the population variances are equal. Let days following no advertisements be Population 1 and let days following advertising be Population 2. Step 3 of 3: Draw a…arrow_forwardA medical journal published the results of a study to compare the effectiveness of handwashing with soap and handrubbing with alcohol. Health care workers who used handrubbing had a mean bacterial count of 34 per hand with a standard deviation of 65. Health care workers who used handwashing had a mean bacterial count of 67 per hand with a standard deviation of 103. In a random sample of 50 health care workers, all using the same method of cleaning their hands, the mean bacterial count per hand, x, is less than 33. Give your opinion on whether this sample of workers used handrubbing with alcohol or handwashing with soap. Click the icon to view the table of normal curve areas. Since the probability of x being less than 33 is alcohol, and used if this sample of workers used handrubbing with ▼if they used handwashing with soap, it is more likely that this sample of workersarrow_forward
- A pharmaceutical company needs to know if its new cholesterol drug, Praxor, is effective at lowering cholesterol levels. It believes that people who take Praxor will average a greater decrease in cholesterol level than people taking a placebo. After the experiment is complete, the researchers find that the 44 participants in the treatment group lowered their cholesterol levels by a mean of 18.7 points with a standard deviation of 3.3 points. The 39 participants in the control group lowered their cholesterol levels by a mean of 18.1 points with a standard deviation of 2.1 points. Assume that the population variances are not equal and test the company’s claim at the 0.02 level. Let the treatment group be Population 1 and let the control group be Population 2. Step 1 of 3 : State the null and alternative hypotheses for the test. Fill in the blank below. H0: μ1=μ2 Ha : μ1⎯⎯⎯⎯⎯⎯⎯⎯⎯⎯⎯⎯⎯⎯⎯μ2 Step 2 of 3: what is the test statistic Step 3 of 3: draw a conclusion, fail or reject. Is…arrow_forwardThe mean number of English courses taken in a two-year time period by male and female college students is believed to be about the same. An experiment is conducted and data are collected from 29 males and 16 females. The males took an average of three English courses with a standard deviation of 0.8. The females took an average of four English courses with a standard deviation of 1.0. Are the means statistically the same? (Assume a 5% level of significance.)arrow_forwardThe Chartered Financial Analyst (CFA) designation is fast becoming a requirement for serious investment professionals. It is an attractive alternative to getting an MBA for students wanting a career in investment. A student of finance is curious to know if a CFA designation is a more lucrative option than an MBA. He collects data on 38 recent CFAs with a mean salary of $138,000 and a standard deviation of $34,000. A sample of 80 MBAs results in a mean salary of $130,000 with a standard deviation of $46,000.a) Specify the hypotheses to test whether a CFA designation is more lucrative than an MBA.b) Calculate the value of the test statistic and the p-value. Do not assume that the population variances are equal.c) At the 5% significance level, is a CFA designation more lucrative than an MBA?arrow_forward
- The Chartered Financial Analyst (CFA) designation is fast becoming a requirement for serious investment professionals. It is an attractive alternative to getting an MBA for students wanting a career in investment. A student of finance is curious to know if a CFA designation is a more lucrative option than an MBA. He collects data on 36 recent CFAS with a mean salary of $145,000 and a standard deviation of $36,000. A sample of 47 MBAS results in a mean salary of $135,000 with a standard deviation of $24,000. Assume that H, is the population mean for individuals with a CFA designation and u, is the population mean of individuals with MBAS. (You may find it useful to reference the appropriate table: z table or t table) a. Set up the hypotheses to test if a CFA designation is more lucrative than an MBA at the 10% significance level. O Họ: 41- H2 = 0; HA: H1 - H2# 0 O Ho: 1-4220; HA H1 - 4200 b-1. Calculate the value of the test statistic. Do not assume that the population variances are…arrow_forwardA pharmaceutical company needs to know if its new cholesterol drug, Praxor, is effective at lowering cholesterol levels. It believes that people who take Praxor will average a greater decrease in cholesterol level than people taking a placebo. After the experiment is complete, the researchers find that the 46 participants in the treatment group lowered their cholesterol levels by a mean of 19.5 points with a standard deviation of 4.9 points. The 37 participants in the control group lowered their cholesterol levels by a mean of 18.4 points with a standard deviation of 4.1 points. Assume that the population variances are not equal and test the company's claim at the 0.02 level. Let the treatment group be Population 1 and let the control group be Population 2. Step 2 of 3: Compute the value of the test statistic. Round your answer to three decimal places.arrow_forwardA blood bank is conducting a study on how much time is required of their patients for blood platelet donations. Based on past records, time spent in the waiting room has a mean of 5 minutes and a standard deviation of 1 minute, time spent with a nurse who reviews patients' medical records and measures their vital signs has a mean of 10 minutes and a standard deviation of 3 minutes, and the actual donation time has a mean of 130 minutes and a standard deviation of 8 minutes. Assuming these three times are independent and can all be modeled using a normal distribution, approximately what proportion of donors finish the entire donation process in under 2.5 hours (150 minutes)? (A) 0.66 (B) 0.72 (C) 0.84 (D) 0.89 (E) 0.99arrow_forward
- A pharmaceutical company needs to know if its new cholesterol drug, Praxor, is effective at lowering cholesterol levels. It believes that people who take Praxor will average a greater decrease in cholesterol level than people taking a placebo. After the experiment is complete, the researchers find that the 34 participants in the treatment group lowered their cholesterol levels by a mean of 22.2 points with a standard deviation of 3.4 points. The 42 participants in the control group lowered their cholesterol levels by a mean of 21.2 points with a standard deviation of 1.8 points. Assume that the population variances are not equal and test the company's claim at the 0.10 level. Let the treatment group be Population 1 and let the control group be Population 2. Step 1 of 3: State the null and alternative hypotheses for the test. Fill in the blank below. Ho:₁ = ₂ Ha: M •M₂arrow_forwardA new small business wants to know if its current radio advertising is effective. The owners decide to look at the mean number of customers who make a purchase in the store on days immediately following days when the radio ads are played as compared to the mean for those days following days when no radio advertisements are played. They found that for 13 days following no advertisements, the mean was 23.9 purchasing customers with a standard deviation of 1.9 customers. On 6 days following advertising, the mean was 24.7 purchasing customers with a standard deviation of 1.6 customers. Test the claim, at the 0.01 level, that the mean number of customers who make a purchase in the store is lower for days following no advertising compared to days following advertising. Assume that both populations are approximately normal and that the population variances are equal. Let days following no advertisements be Population 1 and let days following advertising be Population 2. Step 3 of 3: Draw a…arrow_forwardA research article reported that for a random sample of 850 meal purchases made at fast food chain A, the mean number of calories was 1,004, and the standard deviation was 489. For a random sample of 2,108 meal purchases made at fast food chain B, the mean number of calories was 905, and the standard deviation was 622. Based on these samples, is there convincing evidence that the mean number of calories in fast food chain B meal purchases is less than the mean number of calories in fast food chain A meal purchases? (Test the relevant hypotheses using a 0.05 level of significance. Use ?1 for fast food chain B and ?2 for fast food chain A.) State the appropriate null and alternative hypotheses. Find the test statistic and P-value. (Use SALT. Round your test statistic to one decimal place and your P-value to three decimal places.) t= P-value= State the conclusion in the problem context. We fail to reject H0. There is convincing evidence that the mean number of calories in fast food…arrow_forward
arrow_back_ios
arrow_forward_ios
Recommended textbooks for you
- MATLAB: An Introduction with ApplicationsStatisticsISBN:9781119256830Author:Amos GilatPublisher:John Wiley & Sons Inc
 Probability and Statistics for Engineering and th...StatisticsISBN:9781305251809Author:Jay L. DevorePublisher:Cengage Learning
 Statistics for The Behavioral Sciences (MindTap C...StatisticsISBN:9781305504912Author:Frederick J Gravetter, Larry B. WallnauPublisher:Cengage Learning
  Elementary Statistics: Picturing the World (7th E...StatisticsISBN:9780134683416Author:Ron Larson, Betsy FarberPublisher:PEARSON
 The Basic Practice of StatisticsStatisticsISBN:9781319042578Author:David S. Moore, William I. Notz, Michael A. FlignerPublisher:W. H. Freeman
 Introduction to the Practice of StatisticsStatisticsISBN:9781319013387Author:David S. Moore, George P. McCabe, Bruce A. CraigPublisher:W. H. Freeman
MATLAB: An Introduction with Applications
Statistics
ISBN:9781119256830
Author:Amos Gilat
Publisher:John Wiley & Sons Inc
Probability and Statistics for Engineering and th...
Statistics
ISBN:9781305251809
Author:Jay L. Devore
Publisher:Cengage Learning
Statistics for The Behavioral Sciences (MindTap C...
Statistics
ISBN:9781305504912
Author:Frederick J Gravetter, Larry B. Wallnau
Publisher:Cengage Learning
Elementary Statistics: Picturing the World (7th E...
Statistics
ISBN:9780134683416
Author:Ron Larson, Betsy Farber
Publisher:PEARSON
The Basic Practice of Statistics
Statistics
ISBN:9781319042578
Author:David S. Moore, William I. Notz, Michael A. Fligner
Publisher:W. H. Freeman
Introduction to the Practice of Statistics
Statistics
ISBN:9781319013387
Author:David S. Moore, George P. McCabe, Bruce A. Craig
Publisher:W. H. Freeman