MATLAB: An Introduction with Applications
6th Edition
ISBN: 9781119256830
Author: Amos Gilat
Publisher: John Wiley & Sons Inc
expand_more
expand_more
format_list_bulleted
Question

Transcribed Image Text:-
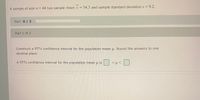
A sample of size n=44 has sample mean x = 54.3 and sample standard deviations=9.2.
Part: 0 / 2
Part 1 of 2
Construct a 95% confidence interval for the population mean u. Round the answers to one
decimal place.
A 95% confidence interval for the population mean u is
<µ<
Expert Solution
This question has been solved!
Explore an expertly crafted, step-by-step solution for a thorough understanding of key concepts.
This is a popular solution
Trending nowThis is a popular solution!
Step by stepSolved in 2 steps

Knowledge Booster
Similar questions
- Find the critical value x²R corresponding to a sample size of 19 and a confidence level of 99 percent. X²R = (Round to 3 decimals)arrow_forwardA sample of n=41n=41 data values randomly selected from a normally distributed population has variance s2=30s2=30. Construct a 95% confidence interval for the population variance. Round your endpoints to one decimal place.arrow_forwardfind out the confidence interval for population proportion for given data [ 4 decimal places ] population standard deviation =4 xbar = 123.5 sample size= 100 c= 0.95arrow_forward
- Part Variability is critical in the manufacturing of the ball bearings. Large variances in the size of the ball bearings cause bearing failure and rapid wear out. Production standards call for a maximum variance of .0001 when the bearing sizes are measured in inches. A sample of 15 bearings shows a sample standard deviation of .014. a. Compute the 90% confidence interval estimate of the variance of the ball bearings in the population. b. Use a= 0.10 to determine whether the sample indicates that the maximum acceptable variance is being exceeded. Use critical value approach. ( Note: You must state null and alternative hypotheses, compute the test statistic, Report the critical Value, and draw a conclusion.arrow_forwardA sample of n=17n=17 data values randomly selected from a normally distributed population has standard deviation s=6.8s=6.8. Construct a 95% confidence interval for the population standard deviation. Round your endpoints to one decimal place.arrow_forwardEnergy drinks: A survey of college students reported that in a sample of 402 male college students, the average number of energy drinks consumed per month was 2.41 with a standard deviation of 3.18, and in a sample of 390 female college students, the average was 1.50 with a standard deviation of 4.77. Part: 0/2 Part 1 of 2 Construct a 80% confidence interval for the difference between men and women in the mean number of energy drinks consumed. Let μ, denote the mean number of energy drinks consumed by men. Use tables to find the critical value and round the answers to at least two decimal places. A 80% confidence interval for the difference between men and women in the mean number of energy drinks consumed is 0<44-₂2 <0. X S Part: 1/2 Part 2 of 2 Based on the confidence interval, is it reasonable to believe that the mean number of energy drinks consumed may be the same for both male and female college students? It (Choose one) reasonable to believe that the mean number of energy drinks…arrow_forward
- A sample of 120 students yielded a sample mean GPA of 3.35, end a sample standard deviation equal to 0.28. Calculate the 95% confidence interval for the population mean GPA.arrow_forwardAssume that a sample is used to estimate a population mean μ . Find the 95% confidence interval for a sample of size 582 with a mean of 34.8 and a standard deviation of 8.1. Enter your answers accurate to three decimal places. Confidence Interval = ( , )arrow_forward
arrow_back_ios
arrow_forward_ios
Recommended textbooks for you
 MATLAB: An Introduction with ApplicationsStatisticsISBN:9781119256830Author:Amos GilatPublisher:John Wiley & Sons Inc
 Probability and Statistics for Engineering and th...StatisticsISBN:9781305251809Author:Jay L. DevorePublisher:Cengage Learning
 Statistics for The Behavioral Sciences (MindTap C...StatisticsISBN:9781305504912Author:Frederick J Gravetter, Larry B. WallnauPublisher:Cengage Learning
 Elementary Statistics: Picturing the World (7th E...StatisticsISBN:9780134683416Author:Ron Larson, Betsy FarberPublisher:PEARSON
 The Basic Practice of StatisticsStatisticsISBN:9781319042578Author:David S. Moore, William I. Notz, Michael A. FlignerPublisher:W. H. Freeman
 Introduction to the Practice of StatisticsStatisticsISBN:9781319013387Author:David S. Moore, George P. McCabe, Bruce A. CraigPublisher:W. H. Freeman

MATLAB: An Introduction with Applications
Statistics
ISBN:9781119256830
Author:Amos Gilat
Publisher:John Wiley & Sons Inc

Probability and Statistics for Engineering and th...
Statistics
ISBN:9781305251809
Author:Jay L. Devore
Publisher:Cengage Learning

Statistics for The Behavioral Sciences (MindTap C...
Statistics
ISBN:9781305504912
Author:Frederick J Gravetter, Larry B. Wallnau
Publisher:Cengage Learning

Elementary Statistics: Picturing the World (7th E...
Statistics
ISBN:9780134683416
Author:Ron Larson, Betsy Farber
Publisher:PEARSON

The Basic Practice of Statistics
Statistics
ISBN:9781319042578
Author:David S. Moore, William I. Notz, Michael A. Fligner
Publisher:W. H. Freeman

Introduction to the Practice of Statistics
Statistics
ISBN:9781319013387
Author:David S. Moore, George P. McCabe, Bruce A. Craig
Publisher:W. H. Freeman