Advanced Engineering Mathematics
10th Edition
ISBN: 9780470458365
Author: Erwin Kreyszig
Publisher: Wiley, John & Sons, Incorporated
expand_more
expand_more
format_list_bulleted
Concept explainers
Topic Video
Question
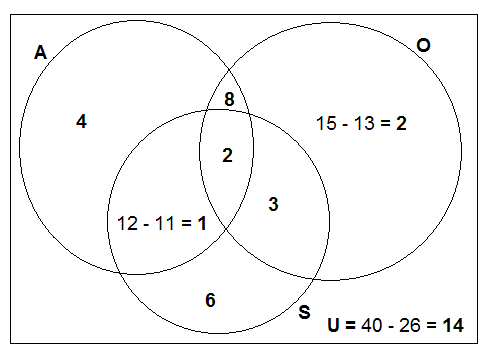
A sample of forty people was asked what type of fruit they had eaten the previous day. Four people answered apples only, fifteen people answered oranges and twelve people answered strawberries. Six people ate strawberries only. Eight people answered apples and oranges only. Three people answered oranges and strawberries. Two people ate all three types of fruit.
Use a Venn Diagram to answer these questions after reading.
a. How many people ate apples? _________
b. How many people ate at least two of these fruits that day? _________
Expert Solution
arrow_forward
Step 1
According to the given information the Venn Diagram can be drawn as,

Trending nowThis is a popular solution!
Step by stepSolved in 2 steps with 1 images

Knowledge Booster
Learn more about
Need a deep-dive on the concept behind this application? Look no further. Learn more about this topic, advanced-math and related others by exploring similar questions and additional content below.Similar questions
- 600 students at Drew High School were surveyed. 269 of them were males. 455 of the students' wear jewelry, and 300 of the students that wear jewelry are females. 1. Draw a Venn diagram and label the data.arrow_forwardBoats use either 1, 2 or 3 signal flags to communicate with other boats (note: a signal with red flag on top and black flag on the bottum, has a different meaning than one with black on top and red on the bottum). If there are 10 different colours possible on flags, wha are the total signals possible for a boat to make?arrow_forwardIn a scatterplot, the more dispersion there is in the points, the _____ the association. a. stronger b. weakerarrow_forward
- Q6. Which of these statements are correct? I. In a bar graph the horizontal axis has categorical data and a histogram has numerical intervals. In a bar graph the frequency is depicted by the height of the bar. In a histogram the I. frequency is depicted by the area of the bar. II. In a bar chart the bars can have gaps between them but in a histogram the bars have no spaces between them. A. I. & II. B. II. & III. C. I. & III. D. I. & II. & I. O A. A В. В О С. С O D. Darrow_forwardtatcrunch 2 Refer to the accompanying data display that results from a sample of airport data speeds in Mbps. Complete parts (a) through (c) below. Click the icon to view at distribution table. W S X H d a. What is the number of degrees of freedom that should be used for finding the critical value t/2? df = 0 (Type a whole number.) b. Find the critical value t/2 corresponding to a 95% confidence level. ¹ x/2 = (Round to two decimal places as needed.) c. Give a brief general description of the number of degrees of freedom. Tech help # 3 OA. The number of degrees of freedom for a collection of sample data is the total number of sample values. OB. The number of degrees of freedom for a collection of sample data is the number of sample values that can vary after certain restrictions have been imposed on all data values. 20 E D с F3 $ 4 888 R F V % 5 T G F5 B MacBook Air Y H 8 7 N F7 TEE U J 00* 8 ►II M F8 9 K O L command F10 P { alt option (13.046,22.15) x=17.598 Sx=16.01712719 n=50 1 Next…arrow_forwardThe Venn diagram shows the number of people that answered a survey about where they go grocery shopping. People who go to the grocery store 25 People who go to a farmer's market 36 8 According to the Venn diagram, if 60 people were surveyed, how many people shop at both the grocery store and the farmer's market?arrow_forward
- Show work pleasearrow_forward3. We are interested in seeing if 4-ounce chocolate bars are being accurately created to contain 4-ounces. Random samples of size 6 were taken and weighed. Five hours of observation provided the following data: Sample Меan Range 1 3.91 0.10 I. 4.07 0.16 3.85 0.17 4 4.02 0.19 3.83 0.22 2. 3.arrow_forward
arrow_back_ios
arrow_forward_ios
Recommended textbooks for you
 Advanced Engineering MathematicsAdvanced MathISBN:9780470458365Author:Erwin KreyszigPublisher:Wiley, John & Sons, Incorporated
 Numerical Methods for EngineersAdvanced MathISBN:9780073397924Author:Steven C. Chapra Dr., Raymond P. CanalePublisher:McGraw-Hill Education
 Introductory Mathematics for Engineering Applicat...Advanced MathISBN:9781118141809Author:Nathan KlingbeilPublisher:WILEY
 Mathematics For Machine TechnologyAdvanced MathISBN:9781337798310Author:Peterson, John.Publisher:Cengage Learning,


Advanced Engineering Mathematics
Advanced Math
ISBN:9780470458365
Author:Erwin Kreyszig
Publisher:Wiley, John & Sons, Incorporated

Numerical Methods for Engineers
Advanced Math
ISBN:9780073397924
Author:Steven C. Chapra Dr., Raymond P. Canale
Publisher:McGraw-Hill Education

Introductory Mathematics for Engineering Applicat...
Advanced Math
ISBN:9781118141809
Author:Nathan Klingbeil
Publisher:WILEY

Mathematics For Machine Technology
Advanced Math
ISBN:9781337798310
Author:Peterson, John.
Publisher:Cengage Learning,

