
MATLAB: An Introduction with Applications
6th Edition
ISBN: 9781119256830
Author: Amos Gilat
Publisher: John Wiley & Sons Inc
expand_more
expand_more
format_list_bulleted
Related questions
Concept explainers
Topic Video
Question
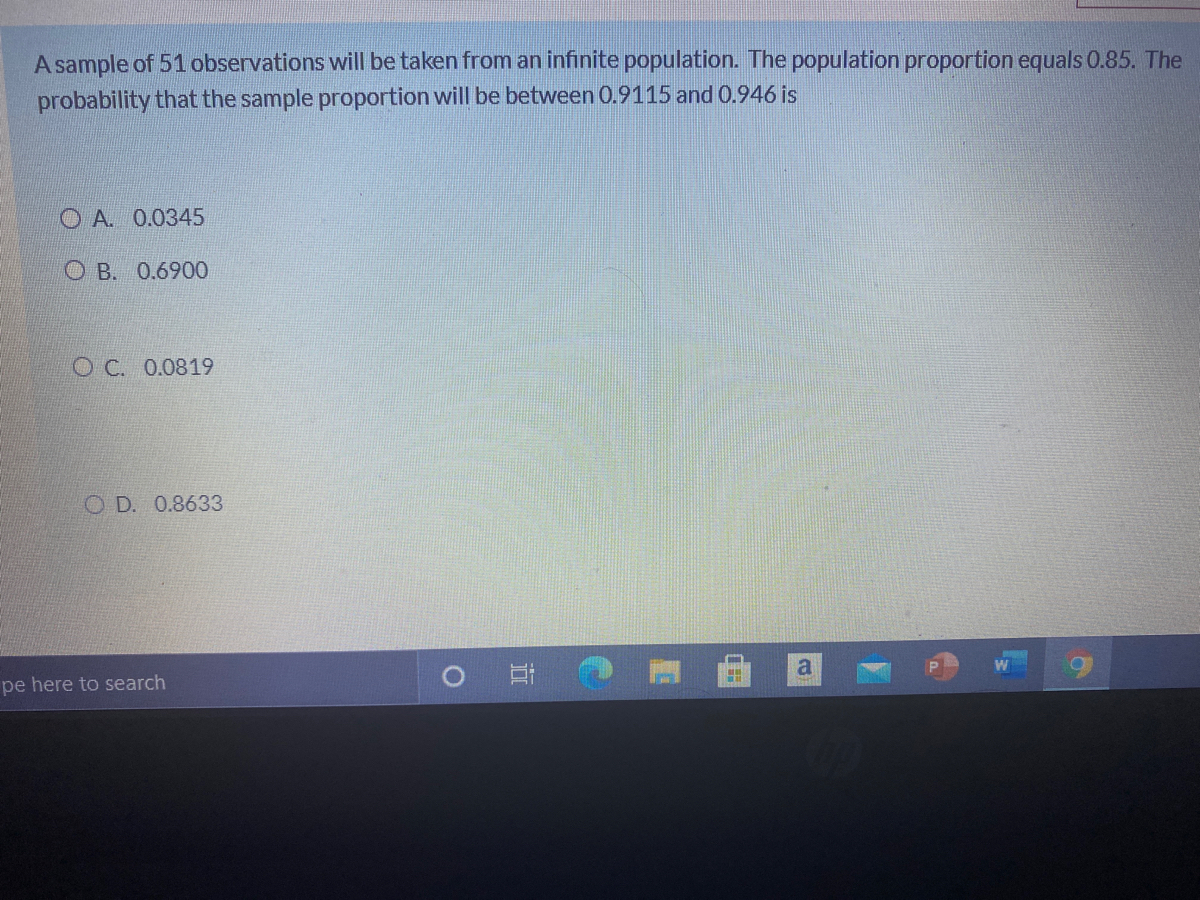

Transcribed Image Text:A sample of 51 observations will be taken from an infinite population. The population proportion equals 0.85. The
probability that the sample proportion will be between 0.9115 and 0.946 is
O A. 0.0345
O B. 0.6900
O C. 0.0819
O D. 0.8633
pe here to search
Expert Solution
This question has been solved!
Explore an expertly crafted, step-by-step solution for a thorough understanding of key concepts.

This is a popular solution

Trending nowThis is a popular solution!

Step by stepSolved in 3 steps with 3 images

Knowledge Booster


Learn more about
Need a deep-dive on the concept behind this application? Look no further. Learn more about this topic, statistics and related others by exploring similar questions and additional content below.Similar questions
- In a family with 10 children the p probability of a boy =0.5. Find the exact probability of less than 2 boys. And find the normal approximate probability of less than 2 boys. O A. Exact = 0.550, Approx = 0.570 %3D B. Exact = 0.005, Approx = 0.007 OC. Exact = 0.055, Approx = 0.057 %3D OD. Exact = 0.055, Approx = 1.0 %3Darrow_forwardFind the indicated probability and interpret the result. From 1975 through 2020, the mean annual gain of the Dow Jones Industrial Average was 653. A random sample of 33 years is selected from this population. What is the probability that the mean gain for the sample was between 400 and 800? Assume σ = 1540. The probability is ☐ (Round to four decimal places as needed.)arrow_forwardIn a waiting line situation, arrivals occur at a rate of 2 per minute, and the service times average 18 seconds. *Please show formulas in EXCEL format a. What is λ? 2 per min b. What is μ? 18 seconds c. Find probability of no units in the system. d. Find average number of units in the system. e. Find average time in the waiting line. f. Find average time in the system. g. Find probability that there is one person waiting. h. Find probability an arrival will have to wait.arrow_forward
- The NIH is creating a test for the Zika virus. The incidence of a Zika is low, 11 percent in the general population. There is a trial version, but it sometimes misses the disease. The probability of a false negative is 0.03. Similarly, someone who does not have Zika, will sometimes get a positive reading. The probability of this is 0.1. Fill in the tree diagram and... Answer as a decimal to 4 decimal places. D = event that someone actually has Zika %3D positive = event that a test states that a person has Zika Conditional Marginal Probabilities Joint Probabilities Probabilities 0.9700 Enter an integer or decimal number [more..] P(D and positive) P(positive | D) False 0.1100 0.0300 negative P(D) P(negative | D) P(D and negative) 0.1000 False Positive 0.8900 P(no D) P(positive | no D) P(no D and positive) 0.9000 P(negative | no D) P(no D and negative)arrow_forwardSamuel F.B. Morse (1791 – 1872), the creator of Morse Code, claimed that 12% of all letters used in the English language were “e”s. Suppose random samples of 196 letters are selected from a book What is the probability that a random sample of 196 letters will contain at least 10% "e"s? Type your calculated z-score here. Express its value to the nearest hundredth (two decimal places). Type your probability here. Express its value to four decimal places. Do not round.arrow_forwardAssume that thermometer readings are normally distributed with a mean of 0 degreesC and a standard deviation of 1.00degreesC. A thermometer is randomly selected and tested. For the case below, draw a sketch, and find the probability of the reading. (The given values are in Celsius degrees.) Between 0.50 and 2.00arrow_forward
- The NJ Department of Health has reported the average life span of NJ residents is 81 years. If the standard deviation is σ = 4 years, what is the probability of a person living to at least 92 years of age?arrow_forwardThe probabilities that a batch of 4 computers will contain 0, 1, 2, 3, and 4 defective computers are 0.6561, 0.2916, 0.0486, 0.0036, and 0.0001, respectively. Find the standard deviation for the probability distribution. Round to the nearest hundredth. A. σ=0.53 B. σ=0.36 C. σ=0.60 D. σ=0.72arrow_forwardTo the nearest tenth of a percent, the highest consumer price index was occurred in the yeararrow_forward
- Suppose that the weight of an newborn fawn is Uniformly distributed between 2.2 and 3 kg. Suppose that a newborn fawn is randomly selected. Round answers to 4 decimal places when possible. a. The mean of this distribution is b. The standard deviation is c. The probability that fawn will weigh exactly 2.8 kg is P(x = 2.8) = d. The probability that a newborn fawn will be weigh between 2.6 and 2.8 is P(2.6 < x < 2.8) =arrow_forwardThe bottom panel of figure 1 (p. 311) shows the probability histogram for the total number of spots when a pair of dice are rolled. (a) The chance that the total number of spots will be between 7 and 10 (inclusive) equals the area under the histogram between ___and ___ (b) The chance that the total number of spots will be 7 equals the area under the histogram between ___ and ____arrow_forward
arrow_back_ios
arrow_forward_ios
Recommended textbooks for you
- MATLAB: An Introduction with ApplicationsStatisticsISBN:9781119256830Author:Amos GilatPublisher:John Wiley & Sons Inc
 Probability and Statistics for Engineering and th...StatisticsISBN:9781305251809Author:Jay L. DevorePublisher:Cengage Learning
 Statistics for The Behavioral Sciences (MindTap C...StatisticsISBN:9781305504912Author:Frederick J Gravetter, Larry B. WallnauPublisher:Cengage Learning
  Elementary Statistics: Picturing the World (7th E...StatisticsISBN:9780134683416Author:Ron Larson, Betsy FarberPublisher:PEARSON
 The Basic Practice of StatisticsStatisticsISBN:9781319042578Author:David S. Moore, William I. Notz, Michael A. FlignerPublisher:W. H. Freeman
 Introduction to the Practice of StatisticsStatisticsISBN:9781319013387Author:David S. Moore, George P. McCabe, Bruce A. CraigPublisher:W. H. Freeman
MATLAB: An Introduction with Applications
Statistics
ISBN:9781119256830
Author:Amos Gilat
Publisher:John Wiley & Sons Inc
Probability and Statistics for Engineering and th...
Statistics
ISBN:9781305251809
Author:Jay L. Devore
Publisher:Cengage Learning
Statistics for The Behavioral Sciences (MindTap C...
Statistics
ISBN:9781305504912
Author:Frederick J Gravetter, Larry B. Wallnau
Publisher:Cengage Learning
Elementary Statistics: Picturing the World (7th E...
Statistics
ISBN:9780134683416
Author:Ron Larson, Betsy Farber
Publisher:PEARSON
The Basic Practice of Statistics
Statistics
ISBN:9781319042578
Author:David S. Moore, William I. Notz, Michael A. Fligner
Publisher:W. H. Freeman
Introduction to the Practice of Statistics
Statistics
ISBN:9781319013387
Author:David S. Moore, George P. McCabe, Bruce A. Craig
Publisher:W. H. Freeman