
MATLAB: An Introduction with Applications
6th Edition
ISBN: 9781119256830
Author: Amos Gilat
Publisher: John Wiley & Sons Inc
expand_more
expand_more
format_list_bulleted
Related questions
Concept explainers
Question
A sample of 300 random adults livin

Transcribed Image Text:36238/assessment_view/1584974254
K
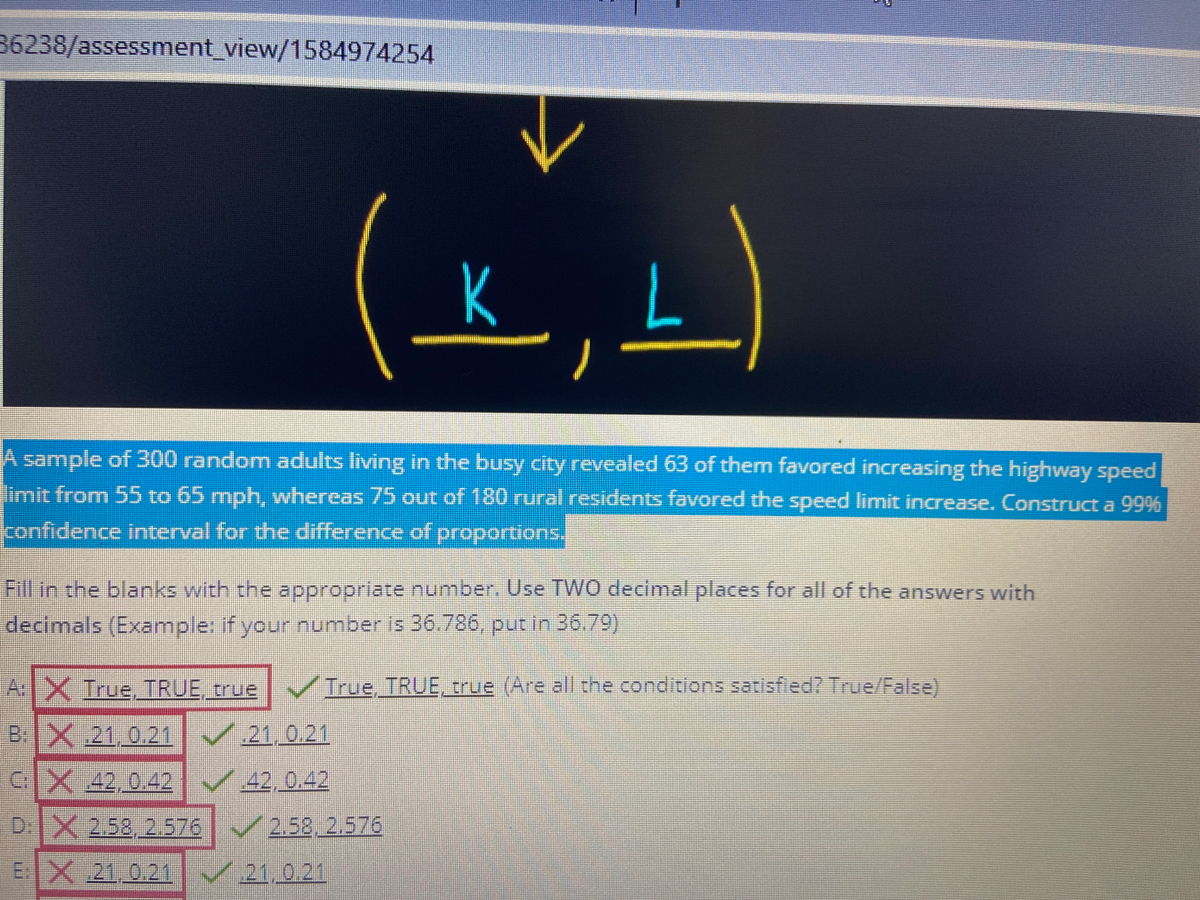
A sample of 300 random adults living
limit from 55 to 65 mph, whereas 75 out of 180 rural residents favored the speed limit increase. Construct a 99%
the busy city revealed 63 of them favored increasing the highway speed
confidence interval for the difference of proportions.
Fill in the blanks with the appropriate number. Use TWO decimal places for all of the answers with
decimals (Example: if your number is 36.786, put in 36.79)
A: X Irue, TRUE, true
True, TRUE, true (Are all the conditions satisfied? True/False)
BX 21,0.21
21,0.21
CIX 42,0.42
42, 0.42
D:X 2.58, 2.576 2.58,2.576
EX 21.0.21 / 21.0.21
Expert Solution
This question has been solved!
Explore an expertly crafted, step-by-step solution for a thorough understanding of key concepts.

Step by stepSolved in 2 steps

Knowledge Booster


Learn more about
Need a deep-dive on the concept behind this application? Look no further. Learn more about this topic, statistics and related others by exploring similar questions and additional content below.Similar questions
- PM Wed Nov 3 Stats Home Insert Draw View 8). Studies have shown that drivers who use cell phones while operating a motor passenger vehicle increase their risk of an accident. To quantify this risk, the New England Journal of Medicine (January 2, 2014) reported on the risk of a crash (or near crash) for both novice and expert drivers when using a cell phone. In a sample of 371 cases of novices using a cell phone while driving, 24 resulted in a crash (or near crash). In a sample of 1,467 cases of experts using a cell phone while driving. 67 resulted in a crash (or near crash). a). Find a 93% confidence interval for p, the true crash risk (probability) for novice drivers, also indicating the ME value. Answer: ME = b). Find a 93% confidence interval for p, the true crash risk (probability) for expert drivers, also indicating the ME value. Answer: гр, ME =arrow_forwardPostpartum depression and anxiety (PPD), is a common medical condition affecting mothers and their families after the birth of a baby. The CDC estimated that 18 % of women who have recently given birth suffer from PPD. However, this research only reflected self-reported cases. Therefore, one group dedicated to helping women and their families with PPD believes that the true percentage of women who suffer from PPD is much higher. The group conducts a simple random sample of 119 women who had given birth in the last year and discovers that 28 of them report having PPD. Based on this evidence, can the group claim that the true percentage of women who have PPD is greater than 18 % ? Use a 0.10 level of significance. Step 1 of 3: State the null and alternative hypotheses for the test. Fill in the blank below. Ho :p = 0.18 Ha:P 0.18 Answer E Tables E Keypad Keyboard Shortcuts O > Prev Nex © 2021 Hawkes Learning JIS Aarrow_forwardThe U.S. Energy Information Administration claimed that U.S. residential customers used an average of 10,608 kilowatt hours (kWh) of electricity this year. A local power company believes that residents in their area use more electricity on average than EIA's reported average. To test their claim, the company chooses a random sample of 187 of their customers and calculates that these customers used an average of 10,737kWh of electricity last year. Assuming that the population standard deviation is 1220kWh, is there sufficient evidence to support the power company's claim at the 0.05 level of significance? Step 2 of 3 : Compute the value of the test statistic. Round your answer to two decimal places.arrow_forward
- In a small town in New York, we initiated a cohort study and followed 5,900 people for a mean follow-up of 2 years. At the end of the 2nd year, none of the participants was lost to follow-up. During this follow-up, we identified 600 cases of Covid-19. What was the cumulative incidence? O 10 cases O 10.1% O 50.8% O 10.1 per 1,000arrow_forwardNews reports speak of an emerging crisis of childhood obesity in the United States. The National Health and Nutrition Examination Survey (NHANES) is a government survey run every several years recording a number of vital statistics on a random sample of Americans. A body mass index (BMI) is computed for each individual in the sample based on the individual's height and weight. Here are sample results for 8-year-old boys over the past 40 years. The table gives the sample size for 3 different surveys, the sample mean and sample standard deviation. Suppose we want to run an ANOVA to see if there is a difference in mean BMI for the three surveys. Assume each survey is a random sample and there are no extreme outliers.What is the sample standard deviations for each survey? ...the NHES II study? ...the NHANES II study? ...the NHANES study?arrow_forwardSection 4.1 Introduction to Probability Score: 4.67/15 4/15 answered Question 10 Giving a test to a group of students, the grades and gender are summarized below valuations A B Male 10 18 6. Female 9. 16 7 If one student was chosen at random, find the probability that the student was male. Probability = (Please enter a reduced fraction.) Submit Question ...jpg pic 16131095275...jpg pic_16131095275..jpg O Zoomday17bsp21.docx pic 1615670389...jpg 17 WX P N 吕口 F3 F4 F5 F2arrow_forward
- Please answer the following question using *********EXCEL******arrow_forwardwhat is the population of focus? a reasearch is being done to determine canopy spread of a type of MATURE tree in a given location. the location has 40,000 of these and the mature trees are estimated at 10feet tall. the research collected spread from 1000 random mature trees.arrow_forward
arrow_back_ios
arrow_forward_ios
Recommended textbooks for you
- MATLAB: An Introduction with ApplicationsStatisticsISBN:9781119256830Author:Amos GilatPublisher:John Wiley & Sons Inc
 Probability and Statistics for Engineering and th...StatisticsISBN:9781305251809Author:Jay L. DevorePublisher:Cengage Learning
 Statistics for The Behavioral Sciences (MindTap C...StatisticsISBN:9781305504912Author:Frederick J Gravetter, Larry B. WallnauPublisher:Cengage Learning
  Elementary Statistics: Picturing the World (7th E...StatisticsISBN:9780134683416Author:Ron Larson, Betsy FarberPublisher:PEARSON
 The Basic Practice of StatisticsStatisticsISBN:9781319042578Author:David S. Moore, William I. Notz, Michael A. FlignerPublisher:W. H. Freeman
 Introduction to the Practice of StatisticsStatisticsISBN:9781319013387Author:David S. Moore, George P. McCabe, Bruce A. CraigPublisher:W. H. Freeman
MATLAB: An Introduction with Applications
Statistics
ISBN:9781119256830
Author:Amos Gilat
Publisher:John Wiley & Sons Inc
Probability and Statistics for Engineering and th...
Statistics
ISBN:9781305251809
Author:Jay L. Devore
Publisher:Cengage Learning
Statistics for The Behavioral Sciences (MindTap C...
Statistics
ISBN:9781305504912
Author:Frederick J Gravetter, Larry B. Wallnau
Publisher:Cengage Learning
Elementary Statistics: Picturing the World (7th E...
Statistics
ISBN:9780134683416
Author:Ron Larson, Betsy Farber
Publisher:PEARSON
The Basic Practice of Statistics
Statistics
ISBN:9781319042578
Author:David S. Moore, William I. Notz, Michael A. Fligner
Publisher:W. H. Freeman
Introduction to the Practice of Statistics
Statistics
ISBN:9781319013387
Author:David S. Moore, George P. McCabe, Bruce A. Craig
Publisher:W. H. Freeman