
MATLAB: An Introduction with Applications
6th Edition
ISBN: 9781119256830
Author: Amos Gilat
Publisher: John Wiley & Sons Inc
expand_more
expand_more
format_list_bulleted
Related questions
Concept explainers
Topic Video
Question
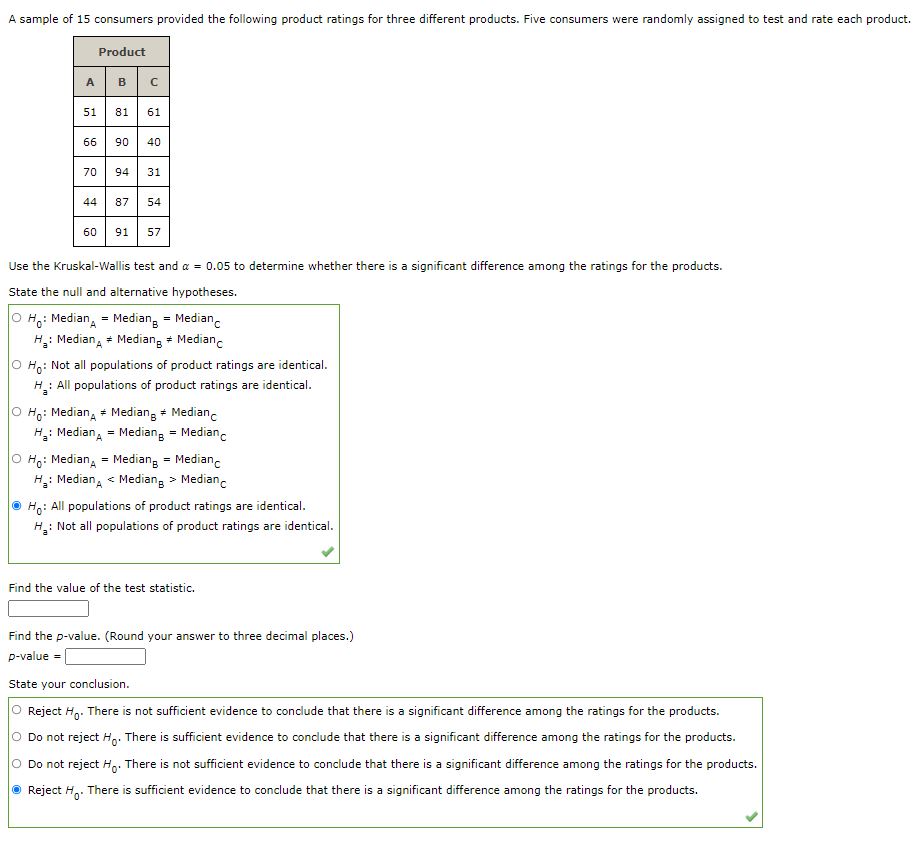

Transcribed Image Text:A sample of 15 consumers provided the following product ratings for three different products. Five consumers were randomly assigned to test and rate each product.
Product
A BC
51
81
61
66
90
40
70
94
31
44
87
54
60 91 57
Use the Kruskal-Wallis test and a = 0.05 to determine whether there is a significant difference among the ratings for the products.
State the null and alternative hypotheses.
H: Median, - Median, = Median.
H,: Median, + Mediang + Median.
O Ho: Not all populations of product ratings are identical.
H: All populations of product ratings are identical.
O Ho: Median, + Median, + Median.
H: Median, = Median, = Median,
O Ho: Median, = Mediang = Median.
H,: Median, < Mediang > Median.
Ho: All populations of product ratings are identical.
H: Not all populations of product ratings are identical.
Find the value of the test statistic.
Find the p-value. (Round your answer to three decimal places.)
p-value =
State your conclusion.
Reject Hg. There is not sufficient evidence to conclude that there is a significant difference among the ratings for the products.
O Do not reject H,. There is sufficient evidence to conclude that there is a significant difference among the ratings for the products.
O Do not reject H,. There is not sufficient evidence to conclude that there is a significant difference among the ratings for the products.
O Reject H. There is sufficient evidence to conclude that there is a significant difference among the ratings for the products.
Expert Solution
This question has been solved!
Explore an expertly crafted, step-by-step solution for a thorough understanding of key concepts.

Step by stepSolved in 4 steps with 3 images

Knowledge Booster


Learn more about
Need a deep-dive on the concept behind this application? Look no further. Learn more about this topic, statistics and related others by exploring similar questions and additional content below.Similar questions
- Identify BOTH the populationand the samplefor thesituation below.A survey of 21pharmacists from Philadelphiafound that 87% of them are vaccinatedarrow_forwardEach customer entering a department store will either buy or not buy some merchandise. An experiment consists of following 5 customers and determining whether or not they purchase any merchandise. What is the number of sample points in the experiment?arrow_forwardExplain the four different types of sampling and give an example of each.arrow_forward
- sixty-five percent of those surveyed reply No to a certain question. If 234 reply No, what is the sample size?arrow_forwardA vaccine to prevent a severe virus was given to children within the first year of life as part of a drug study. The study reported that of the 3456bchildren randomly assigned the vaccine, 58 got the virus. Of the 1606 children randomly assigned the placebo, 46 got the virus. a. Find the sample percentage of children who caught the virus in each group. Is the sample percentage lower for the vaccine group, as investigators hoped? b. Determine whether the vaccine is effective in reducing the chance of catching the virus, using a significance level of 0.01.The first few steps of the hypothesis-testing procedure are given. Complete the procedure.arrow_forwardIdentify which of these types of sampling is used: random, systematic, convenience, stratified, or cluster. 89, 64, and 56 students are selected from the Sophomore, Junior, and Senior class with 893, 647, and 562 students respectively.arrow_forward
- Consider a sample with data values of 27, 25, 20, 15, 30, 34, 28, and 25. Compute the 19th, 24th, 65th, and 75th percentiles. If needed, round your answers to two decimal digits. Percentile Value 19% 24% 65% 75%arrow_forwardA drug company is testing a new pain relief. They select 100 arthritics. Patient and conduct a double blind test of the drug to see if there are any unwanted side effects. 23% Report that they experienced unwanted side effects. Need any sample statisticsarrow_forwardIn 1942, an organization surveyed 1100 adults and asked, "Are you a total abstainer from, or do you on occasion consume, alcoholic beverages?" Of the 1100 adults surveyed, 440 indicated that they were total abstainers. In a recent survey, the same question was asked of 1100 adults and 418 indicated that they were total abstainers. Complete parts (a) and (b) below. (a) Determine the sample proportion for each sample. and respectively. The proportions of the adults who took the 1942 survey and the recent survey who were total abstainers are (Round to three decimal places as needed.)arrow_forward
- A researcher studying allergies to animals is interested in performing a study at the local elementary school. At Pineview Elementary, there are 4 1st grade classrooms. The researcher picks 2 of the 4 classrooms and asks every 1st grader in the 2 classrooms what type of animal they own (cat, dog, rabbit, etc.). He also asks how often they experience allergies. What is the sample?arrow_forwardDefine a test procedure, based on sample data, for deciding whether to reject H0?arrow_forwardIdentify the sampling techniques used in each scenario. a candidate for the local school board surveyed parents picking up their children from the public school on three school days in the last month.arrow_forward
arrow_back_ios
arrow_forward_ios
Recommended textbooks for you
- MATLAB: An Introduction with ApplicationsStatisticsISBN:9781119256830Author:Amos GilatPublisher:John Wiley & Sons Inc
 Probability and Statistics for Engineering and th...StatisticsISBN:9781305251809Author:Jay L. DevorePublisher:Cengage Learning
 Statistics for The Behavioral Sciences (MindTap C...StatisticsISBN:9781305504912Author:Frederick J Gravetter, Larry B. WallnauPublisher:Cengage Learning
  Elementary Statistics: Picturing the World (7th E...StatisticsISBN:9780134683416Author:Ron Larson, Betsy FarberPublisher:PEARSON
 The Basic Practice of StatisticsStatisticsISBN:9781319042578Author:David S. Moore, William I. Notz, Michael A. FlignerPublisher:W. H. Freeman
 Introduction to the Practice of StatisticsStatisticsISBN:9781319013387Author:David S. Moore, George P. McCabe, Bruce A. CraigPublisher:W. H. Freeman
MATLAB: An Introduction with Applications
Statistics
ISBN:9781119256830
Author:Amos Gilat
Publisher:John Wiley & Sons Inc
Probability and Statistics for Engineering and th...
Statistics
ISBN:9781305251809
Author:Jay L. Devore
Publisher:Cengage Learning
Statistics for The Behavioral Sciences (MindTap C...
Statistics
ISBN:9781305504912
Author:Frederick J Gravetter, Larry B. Wallnau
Publisher:Cengage Learning
Elementary Statistics: Picturing the World (7th E...
Statistics
ISBN:9780134683416
Author:Ron Larson, Betsy Farber
Publisher:PEARSON
The Basic Practice of Statistics
Statistics
ISBN:9781319042578
Author:David S. Moore, William I. Notz, Michael A. Fligner
Publisher:W. H. Freeman
Introduction to the Practice of Statistics
Statistics
ISBN:9781319013387
Author:David S. Moore, George P. McCabe, Bruce A. Craig
Publisher:W. H. Freeman