
MATLAB: An Introduction with Applications
6th Edition
ISBN: 9781119256830
Author: Amos Gilat
Publisher: John Wiley & Sons Inc
expand_more
expand_more
format_list_bulleted
Related questions
Question
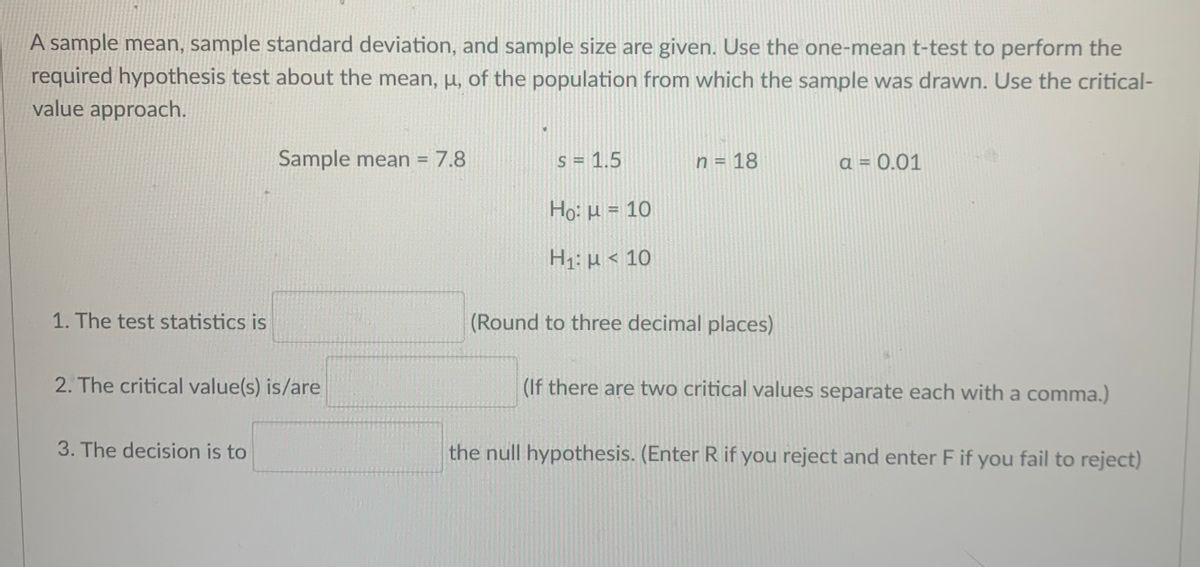

Transcribed Image Text:A sample mean, sample standard deviation, and sample size are given. Use the one-mean t-test to perform the
required hypothesis test about the mean, H, of the population from which the sample was drawn. Use the critical-
value approach.
Sample mean = 7.8
S = 1.5
n = 18
a = 0.01
Ho: µ = 10
H1: µ < 10
1. The test statistics is
(Round to three decimal places)
2. The critical value(s) is/are
(If there are two critical values separate each with a comma.)
3. The decision is to
the null hypothesis. (Enter R if you reject and enter F if you fail to reject)
Expert Solution
This question has been solved!
Explore an expertly crafted, step-by-step solution for a thorough understanding of key concepts.

This is a popular solution

Trending nowThis is a popular solution!

Step by stepSolved in 2 steps

Knowledge Booster


Learn more about
Need a deep-dive on the concept behind this application? Look no further. Learn more about this topic, statistics and related others by exploring similar questions and additional content below.Similar questions
- Test the claim below about the mean of the differences for a population of paired data at the level of significance a. Assume the samples are random and dependent, and the populations are normally distributed. Claim: Hd = 0; a = 0.01. Sample statistics: d = 3.1, s = 8.72, n = 9 Identify the null and alternative hypotheses. Choose the correct answer below. O A. Ho: Ha 0 Ha: Hd s0 F. Ho: Ha s0 Hai Hd>0 The test statistic is t= 1.07 . (Round to two decimal places as needed.) The critical value(s) is(are) to (Round to two decimal places as needed. Use a comma to separate answers as needed.)arrow_forwardComplete parts (a) and (b) below. Click here to view Page 1 of the table of areas under the standard normal curve. Click here to view Page 2 of the table of areas under the standard normal curve. a. The test statistic in a right-tailed test is z= 1.71. Determine the P-value and decide whether, at the 5% significance level, the data provide sufficient evidence to reject the null hypothesis in favor of the alternative hypothesis. The P-value is (Round to three decimal places as needed.) This P-value V sufficient evidence to reject the null hypothesis in favor of the alternative hypothesis because it is V the significance level. b. The test statistic in a right-tailed test is z= - 0.82. Determine the P-value and decide whether, at the 5% significance level, the data provide sufficient evidence to reject the null hypothesis in favor of the alternative hypothesis. The P-value is (Round to three decimal places as needed.) This P-value sufficient evidence to reject the null hypothesis in…arrow_forwardThe manufacturer claims that your new car gets 32 mpg on the highway. You suspect that the mpg is more for your car. The 69 trips on the highway that you took averaged 35.7 mpg and the standard deviation for these 69 trips was 12.4 mpg. What can be concluded at the αα = 0.05 level of significance? For this study, we should use Select an answer z-test for a population proportion t-test for a population mean The null and alternative hypotheses would be: H0:H0: ? p μ Select an answer ≠ = < > H1:H1: ? μ p Select an answer ≠ > = < The test statistic ? t z = (please show your answer to 3 decimal places.) The p-value = (Please show your answer to 4 decimal places.) The p-value is ? > ≤ αα Based on this, we should Select an answer reject fail to reject accept the null hypothesis. Thus, the final conclusion is that ... The data suggest that the population mean is not significantly more than 32 at αα = 0.05, so there is statistically insignificant…arrow_forward
- How do you find the p-value for this?arrow_forwardRed Blood Cell Count: A simple random sample of 300 adult males is taken to measure the red blood cell count (in cells per microliter). Use a significance level of 0.01 to test the claim that the sample has a mean less than the population mean (μ = 5.4 million cells per microliter). Does the sample have a normal distribution? Explain why. Does the result suggest that the male sample has a red blood cell count below 5.4 million cells per microliter? Determine the descriptive statistics of the sample. State the statistical hypotheses: H0 and HA. Determine the α Is this test one or two tailed? What statistical conclusion did you reach regarding the question being evaluated? RED 4.80 4.73 4.47 4.32 4.95 3.95 4.68 4.60 4.09 5.47 4.44 4.15 5.07 4.38 5.22 4.22 4.32 4.30 6.34 5.60 4.93 5.18 3.54 4.61 4.22 4.99 5.23 4.01 4.07 5.06 4.30 4.28 4.76 4.14 4.61 4.67 4.36 4.28 4.59 4.77 3.86 5.38 5.03 4.60…arrow_forwardData on the weights (lb) of the contents of cans of diet soda versus the contents of cans of the regular version of the soda is summarized to the right. Assume that the two samples are independent simple random samples selected from normally distributedpopulations, and do not assume that the population standard deviations are equal. Complete parts (a) and (b) below. Use a 0.01 significance level for both parts. Diet Regular μ μ1 μ2 n 33 33 x 0.78488 lb 0.80356 lb s 0.00444 lb 0.00744 lb a. Test the claim that the contents of cans of diet soda have weights with a mean that is less than the mean for the regular soda. i) What are the null alternative hypothesis? ii) What's the test statics? iii) What's the P-value? iv) State the conclusion vi) construct a confidence interval suitable suitable for testing the claim that the two samples are from populations with the same mean vii) Does the confidence interval…arrow_forward
- Assume that a simple random sample has been selected from a normally distributed population. State the final conclusion.Test the claim that the mean lifetime of car engines of a particular type is greater than 220,000 miles. Sample data are summarized as n = 23, and s = 11,500 miles. Use a significance level of α = 0.01.H0: μ = 220,000 HA: μ > 220,000State your conclusion about H0. Choose the best answer below: A. Reject HA B. Do not reject H0 C. Do not reject HA D. Reject H0 E. Cannot draw a conclusion for information givenarrow_forwardAnswer all these questions correctly thanks.arrow_forwardA sample mean, sample size, and population standard deviation are provided below. Use the one-mean z-test to perform the required hypothesis test at the 10% significance level. x=26 n=20, σ=6 H0: μ=24 Ha: μ>24 The test statistic is z=___________ (Round to two decimal places as needed.) Identify the critical value(s). Select the correct choice below and fill in the answer box within your choice. (Round to two decimal places as needed.) A. The critical values are ±zα/2=±______________ B. The critical value is −zα=_____________ C. The critical value is zα=___________ _____ (Reject, do not reject) the null hypothesis. The data ____________________(do not provide, provide sufficient) evidence to conclude that the mean is (less than 40, equal to 40, not equal to 40, greater than 40)arrow_forward
- Test the claim below about the mean of the differences for a population of paired data at the level of significance a. Assume the samples are random and dependent, and the populations are normally distributed. Claim: 0 В. Но На > 0 Ha: Ha s0 O C. Ho: Ha = 0 Ha: Hd #0 D. Ho: Ha <0 Ha: Hd 20 O E. Ho: Hd + 0 Ha: Hd F. Ho: Hd 20 Ha: Hd = 0 <0 The test statistic is t= (Round to two decimal places as needed.)arrow_forwardUse technology to help you test the claim about the population mean, μ, at the given level of significance, α, using the given sample statistics. Assume the population is normally distributed. Claim: μ>1300; α=0.08; σ=211.56. Sample statistics: x=1326.31, n=250 Identify the null and alternative hypotheses. Choose the correct answer below. A. H0: μ≥1326.31 Ha: μ<1326.31 B. H0: μ≥1300 Ha: μ<1300 C. H0: μ≤1326.31 Ha: μ>1326.31 D. H0: μ>1326.31 Ha: μ≤1326.31 E. H0: μ≤1300 Ha: μ>1300 F. H0: μ>1300 Ha: μ≤1300 Calculate the standardized test statistic. The standardized test statistic is enter your response here. (Round to two decimal places as needed.) Determine the P-value. P=enter your response here (Round to three decimal places as needed.) Determine the outcome and conclusion of the test. ▼ Reject Fail to reject H0. At the 8%…arrow_forwardA sample mean, sample size, and population standard deviation are provided below. Use the one-mean z test to perform the required hypothesis test at the 1% signifigance level. Find the test statistic and p-value. Do we reject or fail to reject? x bar=17 n=36 standard deviation=6 Ho: mean=21 Ha: mean <21arrow_forward
arrow_back_ios
SEE MORE QUESTIONS
arrow_forward_ios
Recommended textbooks for you
- MATLAB: An Introduction with ApplicationsStatisticsISBN:9781119256830Author:Amos GilatPublisher:John Wiley & Sons Inc
 Probability and Statistics for Engineering and th...StatisticsISBN:9781305251809Author:Jay L. DevorePublisher:Cengage Learning
 Statistics for The Behavioral Sciences (MindTap C...StatisticsISBN:9781305504912Author:Frederick J Gravetter, Larry B. WallnauPublisher:Cengage Learning
  Elementary Statistics: Picturing the World (7th E...StatisticsISBN:9780134683416Author:Ron Larson, Betsy FarberPublisher:PEARSON
 The Basic Practice of StatisticsStatisticsISBN:9781319042578Author:David S. Moore, William I. Notz, Michael A. FlignerPublisher:W. H. Freeman
 Introduction to the Practice of StatisticsStatisticsISBN:9781319013387Author:David S. Moore, George P. McCabe, Bruce A. CraigPublisher:W. H. Freeman
MATLAB: An Introduction with Applications
Statistics
ISBN:9781119256830
Author:Amos Gilat
Publisher:John Wiley & Sons Inc
Probability and Statistics for Engineering and th...
Statistics
ISBN:9781305251809
Author:Jay L. Devore
Publisher:Cengage Learning
Statistics for The Behavioral Sciences (MindTap C...
Statistics
ISBN:9781305504912
Author:Frederick J Gravetter, Larry B. Wallnau
Publisher:Cengage Learning
Elementary Statistics: Picturing the World (7th E...
Statistics
ISBN:9780134683416
Author:Ron Larson, Betsy Farber
Publisher:PEARSON
The Basic Practice of Statistics
Statistics
ISBN:9781319042578
Author:David S. Moore, William I. Notz, Michael A. Fligner
Publisher:W. H. Freeman
Introduction to the Practice of Statistics
Statistics
ISBN:9781319013387
Author:David S. Moore, George P. McCabe, Bruce A. Craig
Publisher:W. H. Freeman