
MATLAB: An Introduction with Applications
6th Edition
ISBN: 9781119256830
Author: Amos Gilat
Publisher: John Wiley & Sons Inc
expand_more
expand_more
format_list_bulleted
Related questions
Question
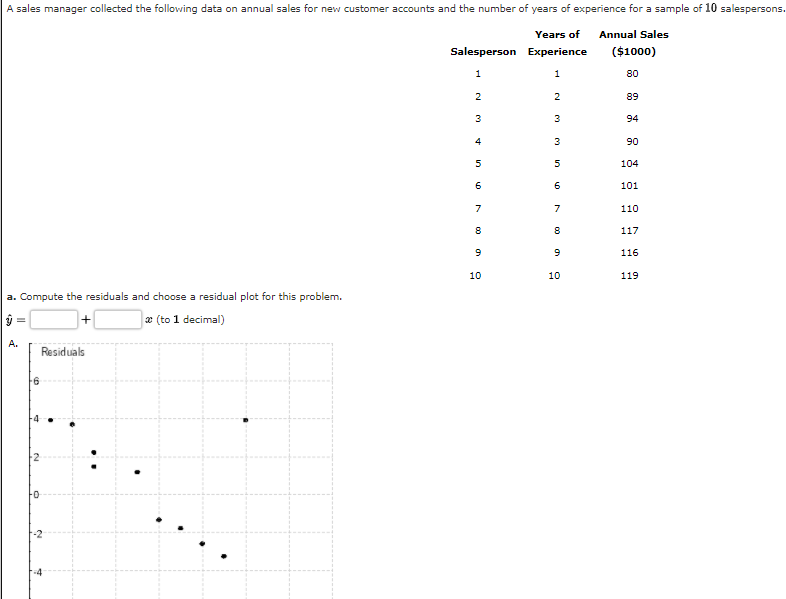

Transcribed Image Text:A sales manager collected the following data on annual sales for new customer accounts and the number of years of experience for a sample of 10 salespersons.
Years of
Annual Sales
Salesperson Experience
($1000)
1
1
80
2
2
89
3
94
90
104
101
7
7
110
117
116
10
10
119
a. Compute the residuals and choose a residual plot for this problem.
|æ (to 1 decimal)
A.
Residuals
-2
00
00
4.
2.

Transcribed Image Text:10
12
D.
Residuals
-4
-6
10
12
The correct plot of the residuals is - Select your answer -
b. Do the assumptions about the error term seem reasonable in light of the residual plot?
The assumptions concerning the error term
Select your answer - v reasonable.
Expert Solution
This question has been solved!
Explore an expertly crafted, step-by-step solution for a thorough understanding of key concepts.

Step by stepSolved in 2 steps with 3 images

Knowledge Booster

Similar questions
- The following table shows the median income, in thousands of dollars, of American families for 2003 through 2008. Year 2003 2004 Income (thousands of dollars) 52.68 54.06 2005 56.19 2006 58.41 2007 2008 61.36 61.52 (a) Plot the data. H H 62 62 61 61 60 60 59 59 58 58 57 57 56 56 55 55 54 54 53 53 2004 2005 2006 2007 2008 2004 2005 2006 2007 2008 H H. 62 62 61 61 60 60 59 59 58 58 57 57 56 56 55 55 54 54 53 53 2004 2005 2006 2007 2008 2004 2005 2006 2007 2008 (b) Use exponential regression to construct an exponential model for the income data. (Let t be years since 2003 and H be the median household income in thousand of dollars.) OH = 62.520 x 0.967 OH = 57.370 x 1.010 OH = 71.932 x 0.856 OH = 49.035 x 1.245 O H = 52.587 x 1.035 (c) What was the yearly percentage growth rate in median family income during this period? (Use the model found in part (b). Round your answer to one decimal place.)arrow_forwardPlease provide solution and logic for questions attached, thanks!arrow_forwardOutside Sr # Tempera (Number Sales X(outsid Y(sales) X*2 Y*2 Y=-5 e ture of Air tempera (Degrees Conditio ture) F) ning units sold) 68 3 68 3 4624 204 1.636 72 72 5 5184 25 360 4.883 78 7 3 78 7. 6084 49 546 9.754 81 12 4 81 12 6561 144 972 12.19 84 15 84 15 7056 225 1260 14.62 86 16 6 86 16 7396 256 1376 16.25 89 22 89 22 7921 484 1958 18.68 91 18 91 18 8281 324 1638 20.31 93 19 9 93 19 8649 361 1767 21.93 94 26 10 94 26 8836 676 2444 22.74 836 143 7059 2553 12525 143 sum Y= Plot a scatter diagram for the data provided on the table above and the linear regression line calculated in topic (b). Consider that: Y: number of air conditioning units sold X: outside temperature (degrees F) rds English (U.S.) Text Predictions: On acerarrow_forward
- From the graphs displayed, is there evidence to suggest that there is a positive linear relationship between Square Feet and Bathrooms, for the population of real estate represented by this sample? Be sure to provide numeric support in your answer.arrow_forwardTable 9.3 Total cholesterol in 25 patients after taking new statin drug. .. Population mean is 200. Cholesterol levels 219 191 198 214 163 264 248 182 235 209 152 148 145 189 213 230 181 180 100 219 102 249 282 188 264 D. b. Describe the effects of the statin drug on your sample. Do you see any change in the level of cholesterol after taking the drug? c. What is your research question? What are the null and alternative hypotheses? Decide if you want to do a one-tailed or two-tailed test. d. What test? Perform it? What is your critical value? Sketch a normal distribution and draw the critical value or values of z. f. What is your conclusion?arrow_forwardThe below data represent the advertising expenditure and sales of Little Liu Ltd from year 2008 to 2017. Table: Advertising Expenditure vs. Sales from 2008 to 2017 Year Advert. Expenditure Sales (x, £000) (y, £000) 2008 8 30 2009 12 40 2010 11 29 2011 5 29 2012 14 43 2013 3 17 2014 6 20 2015 8 30 2016 4 22 2017 9 40 Total 80 300 Figure: Scatter Diagram of Advertising Expenditure and Sales with Trend line ( See picture) What is the statistical relationship shown in the Figure and list out 3 characteristics of this relationship? 2. Work out the values of parameters of the relationship shown in the Figure (i.e. work out the equation of the relationship). 3.Explain the relationship and make recommendations to Little Liu Ltd based on the information given.arrow_forward
arrow_back_ios
arrow_forward_ios
Recommended textbooks for you
- MATLAB: An Introduction with ApplicationsStatisticsISBN:9781119256830Author:Amos GilatPublisher:John Wiley & Sons Inc
 Probability and Statistics for Engineering and th...StatisticsISBN:9781305251809Author:Jay L. DevorePublisher:Cengage Learning
 Statistics for The Behavioral Sciences (MindTap C...StatisticsISBN:9781305504912Author:Frederick J Gravetter, Larry B. WallnauPublisher:Cengage Learning
  Elementary Statistics: Picturing the World (7th E...StatisticsISBN:9780134683416Author:Ron Larson, Betsy FarberPublisher:PEARSON
 The Basic Practice of StatisticsStatisticsISBN:9781319042578Author:David S. Moore, William I. Notz, Michael A. FlignerPublisher:W. H. Freeman
 Introduction to the Practice of StatisticsStatisticsISBN:9781319013387Author:David S. Moore, George P. McCabe, Bruce A. CraigPublisher:W. H. Freeman
MATLAB: An Introduction with Applications
Statistics
ISBN:9781119256830
Author:Amos Gilat
Publisher:John Wiley & Sons Inc
Probability and Statistics for Engineering and th...
Statistics
ISBN:9781305251809
Author:Jay L. Devore
Publisher:Cengage Learning
Statistics for The Behavioral Sciences (MindTap C...
Statistics
ISBN:9781305504912
Author:Frederick J Gravetter, Larry B. Wallnau
Publisher:Cengage Learning
Elementary Statistics: Picturing the World (7th E...
Statistics
ISBN:9780134683416
Author:Ron Larson, Betsy Farber
Publisher:PEARSON
The Basic Practice of Statistics
Statistics
ISBN:9781319042578
Author:David S. Moore, William I. Notz, Michael A. Fligner
Publisher:W. H. Freeman
Introduction to the Practice of Statistics
Statistics
ISBN:9781319013387
Author:David S. Moore, George P. McCabe, Bruce A. Craig
Publisher:W. H. Freeman