
MATLAB: An Introduction with Applications
6th Edition
ISBN: 9781119256830
Author: Amos Gilat
Publisher: John Wiley & Sons Inc
expand_more
expand_more
format_list_bulleted
Related questions
Concept explainers
Topic Video
Question
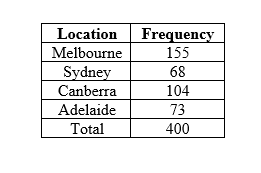
A sale manager of Febreze, air freshener product would like to compare whether the sale distribution reflects the population in four different locations. According to Australian Bureau of Statistics, 35% of the population lives in Melbourne, 21% in Sydney, 24% in the Canberra, and 20% in Adelaide. Table below presents a breakdown of a sample of 400 orders randomly selected from those shipped last month. What is the critical value at the .01 level of risk?

Expert Solution
This question has been solved!
Explore an expertly crafted, step-by-step solution for a thorough understanding of key concepts.

Step by stepSolved in 2 steps with 8 images

Knowledge Booster


Learn more about
Need a deep-dive on the concept behind this application? Look no further. Learn more about this topic, statistics and related others by exploring similar questions and additional content below.Similar questions
- Write an example of a research study that would be most appropriate for a within subjects ANOVAarrow_forwardTourism is extremely important to the economy of Florida. Hotel occupancy is an often-reported measure of visitor volume and visitor activity (Orlando Sentinel, May 19, 2018). Hotel occupancy data for February in two consecutive years are as follows. Current Year 1,476 1,800 Occupied Rooms Total Rooms 1,422 1,800 a. Formulate the hypothesis test that can be used to determine whether there has been an increase in the proportion of rooms occupied over the one-year period. Let P₁= population proportion of rooms occupied for current year P2 population proportion of rooms occupied for previous year - P2 less than or equal to 0 greater than 0 Ho P1 Ha P1 P2 b. What is the estimated proportion of hotel rooms occupied each year (to 2 decimals)? Current year .80 X Previous Year .77 c. Conduct a hypothesis test. What is the p-value (to 4 decimals)? Use Table 1 from Appendix B. Previous Year p-value = 0.0166 Using a 0.05 level of significance, what is your conclusion? We can conclude that there…arrow_forwardListed below are the lead concentrations in different Ayurveda medicines. Ayurveda is a traditional medical system commonly used in India. The lead concentrations listed here are from medicines manufactured in the United States. Use a significance level to test the claim that the mean lead concentration for all such medicines is less than 14. 3.0,6.5,6.0,5.5,20.5,7.5,12.0,20.5,11.5,17.5arrow_forward
- Individual actions can play a large role in the overall health of our planet. A researcher interested in evaluating environment friendly behaviors evaluated how often people recycle (per month) based on whether they have an overall optimistic or an overall pessimistic attitude toward eco-friendly behaviors. The results from this hypothetical study are given in the table. Test whether or not recycling behaviors differed between groups using a .05 level of significance. State the value of the test statistics and the decision to retain or reject the null hypothesis. Compute effect size using eta- squared (n^2). Pessimistic Optimistic 3 4 0 9 4 6 2 8 1 9 6 5 3 6 5 8 0 6 5 7arrow_forwardA car wash is assessing the average wait time for its customers. The median wait time is 4 minutes. Does a customer who waits for 5 minutes represent an abnormal wait time? The customer who waits 5 minutes an abnormal case, because 50% of customers wait more than minutes.arrow_forwardYou decide that you want to make sure your estimate from part a is correct. You go out and gather 10 simple random samples of 25 people in your school and calculate the proportion of students within each sample whose Amazon packages arrive within two business days of ordering. The proportion of customers that receive their packages within two days of ordering are given below. 0.70, 0.75, 0.6, 0.95, 0.90, 0.73, 0.87, 0.86, 0.92, 0.97 Explain why all of the sample proportions are not the same.arrow_forward
- Past studies have indicated that the percentage of smokers was estimated to be about 34%. Given the new smoking cessation programs that have been implemented, you now believe that the percentage of smokers has reduced. You randomly surveyed 1783 people and found that 553 smoke. Use a 0.05 significance level to test the claim that the percentage of smokers has reduced.arrow_forwardShopEasy Inc. is a specialty e-tailer that operates 87 catalogue websites on the Internet. Larson Brown, Sales Director, feels that the style (colour scheme, graphics, fonts, etc.) of a website may affect its sales. He chooses three levels of design style (neon, old world and sophisticated) and randomly assigns six catalogue websites to each design style. Analysis of Larson's data yielded the following ANOVA table: Source of Variation Between Groups Within Groups Total SS 19.43 2.85 O 3.68 O 19.45 O 3.57 df 68102.33 2 34051.17 Using a = 0.05, the critical F value is MS 29177.67 15 1945.178 97280 17 Farrow_forwardAs part of a study on transportation safety, the U.S. Department of Transportation collected data on the number of fatal accidents per 1,000 licenses and the percentage of licensed drivers under the age of 21 in a sample of 42 cities. Prepare a managerial report that analyzes the data. Consider the complete data set collected over a one-year period. Safety Percent Under 21 Fatal Accidents per 1000 12 2.942 11 0.688 7 0.865 11 1.632 10 2.071 16 2.607 17 3.81 7 0.348 12 1.122 7 0.625 8 1.008 15 2.781 11 1.385 8 1.413 9 0.019 8 0.318 10 1.829 11 2.226 13 2.835 13 2.332 10 1.274 16 4.08 7 2.17 15 3.603 14 2.603 8 0.815 7 0.8 13 2.87 7 1.247 14 3.204 9 0.994 9 0.473 13 1.423 17 3.594 9 1.906 13 1.623 15 2.923 11 1.893 14 2.794 12 2.614 8 0.906 16 3.236 Find the mean and standard deviation of licensed drivers under the age of 21. (Round your answers to two decimal places.) MeanStandard deviation Find…arrow_forward
- Imagine a study comparing two groups: undergrad vs. graduate students in terms of stress level. You find that 100% of the graduate students in your study are men and 100% of your undergraduate students are women. What effect does knowing the gender distribution have on your research conclusions?arrow_forwardAccording to the NIMH website the average number of adult Americans diagnosed with a “serious mental illness” across all 50 states in 2019 was μ = 5.2 out of 100 residents (or 5.2%). Please test to see if the sample of states listed below (n=8) has a significantly higher level of mental illness than the population mean of 5.2. Sample data: Arkansas= 5.45%, Montana=5.34%, Vermont=5.32%, Oregon=5.19%, Utah=5.2%, Ohio=5.13, Kentucky=5.25% West Virginia=5.18%. Hint - drop the % signs and use 5.45, 5.32, etc as the X scores. If you want you can use JASP for help with the calculations. Use 3 decimal places for the M, s, SEM. The alpha level for the study was set to α=.05. a. State the hypotheses of the study. b. Find the critical t value for this studyc. Compute the one-sample t test. d. Compute the Cohen's d for the data (even if not significant) e. State the results - is the sample significantly higher? Do you reject the null hypothesis? Report the t test results in APA format…arrow_forwardThe average spent nationally on Christmas gifts in 2020 was reported to be $650 per person. Below is a random sample of gift givers from Iowa and what they spent in 2020. Is there sufficient evidence to conclude that Iowans spend less than the national average? Estimate the average amount spent by Iowans on Christmas gifts in 2020 with a 90%-CI. 700 450 400 525 550 550 600 575 650 625 500arrow_forward
arrow_back_ios
SEE MORE QUESTIONS
arrow_forward_ios
Recommended textbooks for you
- MATLAB: An Introduction with ApplicationsStatisticsISBN:9781119256830Author:Amos GilatPublisher:John Wiley & Sons Inc
 Probability and Statistics for Engineering and th...StatisticsISBN:9781305251809Author:Jay L. DevorePublisher:Cengage Learning
 Statistics for The Behavioral Sciences (MindTap C...StatisticsISBN:9781305504912Author:Frederick J Gravetter, Larry B. WallnauPublisher:Cengage Learning
  Elementary Statistics: Picturing the World (7th E...StatisticsISBN:9780134683416Author:Ron Larson, Betsy FarberPublisher:PEARSON
 The Basic Practice of StatisticsStatisticsISBN:9781319042578Author:David S. Moore, William I. Notz, Michael A. FlignerPublisher:W. H. Freeman
 Introduction to the Practice of StatisticsStatisticsISBN:9781319013387Author:David S. Moore, George P. McCabe, Bruce A. CraigPublisher:W. H. Freeman
MATLAB: An Introduction with Applications
Statistics
ISBN:9781119256830
Author:Amos Gilat
Publisher:John Wiley & Sons Inc
Probability and Statistics for Engineering and th...
Statistics
ISBN:9781305251809
Author:Jay L. Devore
Publisher:Cengage Learning
Statistics for The Behavioral Sciences (MindTap C...
Statistics
ISBN:9781305504912
Author:Frederick J Gravetter, Larry B. Wallnau
Publisher:Cengage Learning
Elementary Statistics: Picturing the World (7th E...
Statistics
ISBN:9780134683416
Author:Ron Larson, Betsy Farber
Publisher:PEARSON
The Basic Practice of Statistics
Statistics
ISBN:9781319042578
Author:David S. Moore, William I. Notz, Michael A. Fligner
Publisher:W. H. Freeman
Introduction to the Practice of Statistics
Statistics
ISBN:9781319013387
Author:David S. Moore, George P. McCabe, Bruce A. Craig
Publisher:W. H. Freeman