
MATLAB: An Introduction with Applications
6th Edition
ISBN: 9781119256830
Author: Amos Gilat
Publisher: John Wiley & Sons Inc
expand_more
expand_more
format_list_bulleted
Related questions
Question
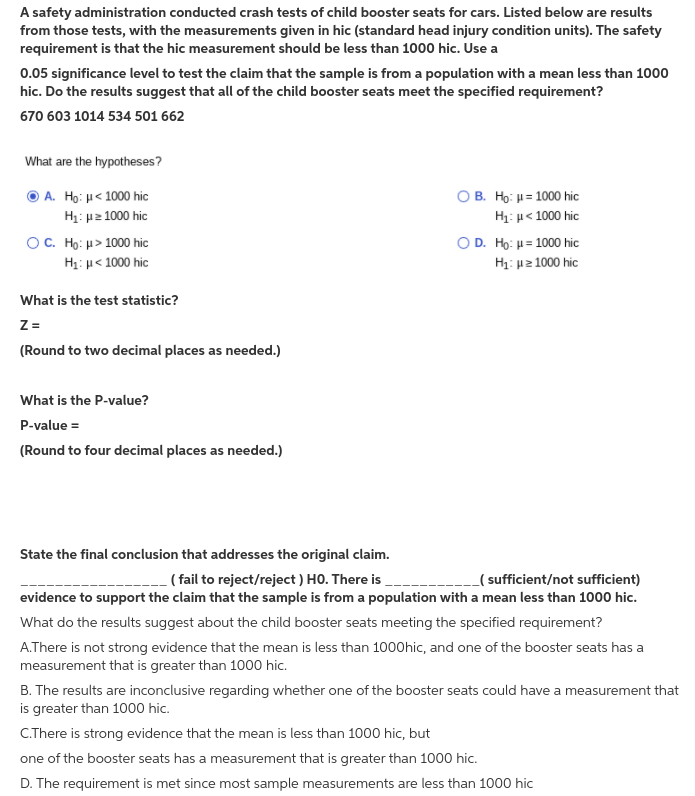

Transcribed Image Text:A safety administration conducted crash tests of child booster seats for cars. Listed below are results
from those tests, with the measurements given in hic (standard head injury condition units). The safety
requirement is that the hic measurement should be less than 1000 hic. Use a
0.05 significance level to test the claim that the sample is from a population with a mean less than 1000
hic. Do the results suggest that all of the child booster seats meet the specified requirement?
670 603 1014 534 501 662
What are the hypotheses?
. H μ< 100 hic
O B. Ho: H= 1000 hic
Hi: με 1000 hic
Η: μ< 1000 hic
OD. Ho: H = 1000 hic
OC. Họ: u> 1000 hic
Hi μ< 1000 hic
Hi με 1000 hic
What is the test statistic?
Z =
(Round to two decimal places as needed.)
What is the P-value?
P-value =
(Round to four decimal places as needed.)
State the final conclusion that addresses the original claim.
- ( fail to reject/reject ) HO. There is
_( sufficient/not sufficient)
evidence to support the claim that the sample is from a population with a mean less than 1000 hic.
What do the results suggest about the child booster seats meeting the specified requirement?
A.There is not strong evidence that the mean is less than 1000hic, and one of the booster seats has a
measurement that is greater than 1000 hic.
B. The results are inconclusive regarding whether one of the booster seats could have a measurement that
is greater than 1000 hic.
C.There is strong evidence that the mean is less than 1000 hic, but
one of the booster seats has a measurement that is greater than 1000 hic.
D. The requirement is met since most sample measurements are less than 1000 hic
Expert Solution
This question has been solved!
Explore an expertly crafted, step-by-step solution for a thorough understanding of key concepts.

This is a popular solution

Trending nowThis is a popular solution!

Step by stepSolved in 6 steps with 1 images

Knowledge Booster

Similar questions
- A student would like to estimate the proportion of students at his school who have lunch during period 4. To do so, he selects a random sample of 40 students and finds that 30% of them have period 4 lunch. Later, he goes to the guidance office and finds that of the 380 students at this school, 25% of them have period 4 lunch. Which of the following properly describes the number, 25%? O sample O statistic O population O parameter Save and Exit Next Submit Mark this and return hp $ & 4. 6. 7 8 e r y f j karrow_forwardThe following data was collected during the Framingham Heart Study. Is there a statistically significant difference in mean SBP between men and women using a 5% level of significance? Sample size Mean Standard Deviation Men 1623 128.2 17.5 Women 1911 126.5 20.1arrow_forwardUse Chebyshevs rule and the empirical rule to describe the distribution of this data set. Count the actual number of observations that fall within one, two, and three standard deviations of the mean if the data set and compare these counts with the description of the the data set I developed.arrow_forward
- The mean value of land and buildings per acre from a sample of farmers is $1500, with a standard derivation of $100. The data set has bell-shaped distribution. Using the empirical rule, determine which of the following farms, whose land and building values per acre are given, are unusual (more than two standards derivations from the mean). Are any of data values very unusual (more then three standard derivations from the mean)? $1357 $1719 $1316 $1176 $1598 $1491arrow_forwardwe look at a random sample of 1000 united flights in the month of December comparing the actual arrival time to the scheduled arrive time. computer output of the descriptive statistics for the difference in actual and expected arrival time of these 1000 flights are shown below : N=1000 Mean =4.06 St Dev. = 45.4 SE Mean =1.44 Min= -35 Q1 = -14 Median = -5 Q3 =9 Max =871 what is the sample mean difference in actual and expected arrival times? what is the standard deviation of the difference ? x bar = and s= ?arrow_forwardThe Bureau of Alcohol, Tobacco, and Firearms (BATF) has been concerned about lead levelsin California wines. In a previous testing of wine specimens, lead levels ranging from 50 to 700parts per billion were recorded. How many wine specimens (at the least) should be tested if theBATF wishes to estimate the mean lead level for California wines to within 10 parts per billionwith 95% confidence?arrow_forward
- A hypertensions trial is mounted and 12 participants are randomly assigned to receive either a new medication or a placebo. Each participant takes assigned medication and their systolic blood pressure (SBP) is recorded after 6 months on the assigned medication the data are shown in table 7-9 is there a difference in the mean SBP between treatment? Run the appropriate test at a =0.05arrow_forwardi need C and Darrow_forward7arrow_forward
arrow_back_ios
arrow_forward_ios
Recommended textbooks for you
- MATLAB: An Introduction with ApplicationsStatisticsISBN:9781119256830Author:Amos GilatPublisher:John Wiley & Sons Inc
 Probability and Statistics for Engineering and th...StatisticsISBN:9781305251809Author:Jay L. DevorePublisher:Cengage Learning
 Statistics for The Behavioral Sciences (MindTap C...StatisticsISBN:9781305504912Author:Frederick J Gravetter, Larry B. WallnauPublisher:Cengage Learning
  Elementary Statistics: Picturing the World (7th E...StatisticsISBN:9780134683416Author:Ron Larson, Betsy FarberPublisher:PEARSON
 The Basic Practice of StatisticsStatisticsISBN:9781319042578Author:David S. Moore, William I. Notz, Michael A. FlignerPublisher:W. H. Freeman
 Introduction to the Practice of StatisticsStatisticsISBN:9781319013387Author:David S. Moore, George P. McCabe, Bruce A. CraigPublisher:W. H. Freeman
MATLAB: An Introduction with Applications
Statistics
ISBN:9781119256830
Author:Amos Gilat
Publisher:John Wiley & Sons Inc
Probability and Statistics for Engineering and th...
Statistics
ISBN:9781305251809
Author:Jay L. Devore
Publisher:Cengage Learning
Statistics for The Behavioral Sciences (MindTap C...
Statistics
ISBN:9781305504912
Author:Frederick J Gravetter, Larry B. Wallnau
Publisher:Cengage Learning
Elementary Statistics: Picturing the World (7th E...
Statistics
ISBN:9780134683416
Author:Ron Larson, Betsy Farber
Publisher:PEARSON
The Basic Practice of Statistics
Statistics
ISBN:9781319042578
Author:David S. Moore, William I. Notz, Michael A. Fligner
Publisher:W. H. Freeman
Introduction to the Practice of Statistics
Statistics
ISBN:9781319013387
Author:David S. Moore, George P. McCabe, Bruce A. Craig
Publisher:W. H. Freeman