MATLAB: An Introduction with Applications
6th Edition
ISBN: 9781119256830
Author: Amos Gilat
Publisher: John Wiley & Sons Inc
expand_more
expand_more
format_list_bulleted
Topic Video
Question

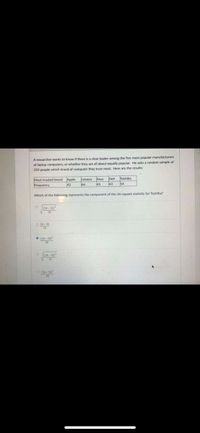
Transcribed Image Text:A researcher wants to know if there is a clear leader among the five most popular manufacturers
of laptop computers, or whether they are all about equally popular. He asks a random sample of
250 people which brand of computer they trust most. Here are the results:
Toshiba
Dll
43
Lenovo Asus
Most-trusted brand Apple
42
66
45
54
Frequency
Which of the following represents the component of the chi-square statistic for Toshiba?
(54- 50)
O 4-50
• (54 - 50)
(54- 50)
V50
Expert Solution
This question has been solved!
Explore an expertly crafted, step-by-step solution for a thorough understanding of key concepts.
This is a popular solution
Trending nowThis is a popular solution!
Step by stepSolved in 2 steps

Knowledge Booster
Learn more about
Need a deep-dive on the concept behind this application? Look no further. Learn more about this topic, statistics and related others by exploring similar questions and additional content below.Similar questions
- An article reported that in a particular year, there were 717 bicyclists killed on public roadways in a particular country, and that the average age of the cyclists killed was 43 years. These figures were based on an analysis of the records of all traffic-related deaths of bicyclists on public roadways of that country. (a) Does the group of 717 bicycle fatalities represent a census or a sample of the bicycle fatalities for that year? O a census O a sample (b) If the population of interest is bicycle traffic fatalities for this particular year, is the given average age of 43 years a number that describes a sample or a number that describes the population? O a number that describes a sample O a number that describes the populationarrow_forwardA 2012 study of freely forming groups in bars all over Europe examined the natural behavior of groups. The researchers recorded the group size (number of individuals in the group) of all 501 groups in the study that were naturally laughing. The findings were displayed in the figure below. 300 Number of groups 250 200 O 52 O 2.7 0 2 150 3.5 4 100 50 0 254 2 Enter your answer here The median laughter group size in this study is 168 3 The mean laughter group size in this study is O 100.2 Enter your answer here 52 4 5 Laughter group size 21 6 6 Can we conclude from these findings that, in European bars in 2012, smaller groups were more likely than larger groups to be naturally laughing? Explain your statistical reasoning in one sentence.arrow_forwardThe following are the ratings of males by females in an experiment involving speed dating. Use the given data to construct a boxplot and identify the 5-number summary. 2.02.03.04.05.05.06.06.06.06.06.07.08.08.08.08.08.58.58.58.5arrow_forward
- 3.8arrow_forwardPersonality preferences for a random sample of 519 people in the listed professions are shown in the following table. T refers to THINKING and F refers to FEELING. Use the chi-square test to determine if the listed occupations and personality preferences are independent at the 0.01 level of significance. Occupation T F Row Total Clergy 57 91 148 M.D. 77 82 159 Lawyer 118 94 212 Column Total 252 267 519arrow_forwardI need help filling in the following blanks based on the attached table: The median frequency of attendance is [Blank]. This means [Blank] percent of people in this sample attend [Blank] or less. The 36th percentile is [Blank]. That means [Blank] percent of people in the same area attend [Blank] or less frequently. The 65th percentile is [Blank]. That means [Blank] percent of people in the same area attend [Blank] or less frequently. frequently.arrow_forward
- Is there an association between hair color and body type? The table below shows the results of a researcher's observations of randomly selected people. Frequencies of Hair Colors for Various Body Types Blonde Brunette Red Head 71 80 96 108 55 115 46 91 Short and Slender Short and Pudgy Tall and Slender Tall and Heavy What can be concluded at the o= 0.01 significance level? 53 74 69 63arrow_forwardHospitals In a study of births in New York State, data were collected from four hospitals coded as follows: (1) Albany Medical Center; (1438) Bellevue Hospital Center; (66) Olean General Hospital; (413) Strong Memorial Hospital. Does it make sense to calculate the average (mean) of the numbers 1, 1438, 66, and 413?arrow_forward
arrow_back_ios
arrow_forward_ios
Recommended textbooks for you
 MATLAB: An Introduction with ApplicationsStatisticsISBN:9781119256830Author:Amos GilatPublisher:John Wiley & Sons Inc
 Probability and Statistics for Engineering and th...StatisticsISBN:9781305251809Author:Jay L. DevorePublisher:Cengage Learning
 Statistics for The Behavioral Sciences (MindTap C...StatisticsISBN:9781305504912Author:Frederick J Gravetter, Larry B. WallnauPublisher:Cengage Learning
 Elementary Statistics: Picturing the World (7th E...StatisticsISBN:9780134683416Author:Ron Larson, Betsy FarberPublisher:PEARSON
 The Basic Practice of StatisticsStatisticsISBN:9781319042578Author:David S. Moore, William I. Notz, Michael A. FlignerPublisher:W. H. Freeman
 Introduction to the Practice of StatisticsStatisticsISBN:9781319013387Author:David S. Moore, George P. McCabe, Bruce A. CraigPublisher:W. H. Freeman

MATLAB: An Introduction with Applications
Statistics
ISBN:9781119256830
Author:Amos Gilat
Publisher:John Wiley & Sons Inc

Probability and Statistics for Engineering and th...
Statistics
ISBN:9781305251809
Author:Jay L. Devore
Publisher:Cengage Learning

Statistics for The Behavioral Sciences (MindTap C...
Statistics
ISBN:9781305504912
Author:Frederick J Gravetter, Larry B. Wallnau
Publisher:Cengage Learning

Elementary Statistics: Picturing the World (7th E...
Statistics
ISBN:9780134683416
Author:Ron Larson, Betsy Farber
Publisher:PEARSON

The Basic Practice of Statistics
Statistics
ISBN:9781319042578
Author:David S. Moore, William I. Notz, Michael A. Fligner
Publisher:W. H. Freeman

Introduction to the Practice of Statistics
Statistics
ISBN:9781319013387
Author:David S. Moore, George P. McCabe, Bruce A. Craig
Publisher:W. H. Freeman