
MATLAB: An Introduction with Applications
6th Edition
ISBN: 9781119256830
Author: Amos Gilat
Publisher: John Wiley & Sons Inc
expand_more
expand_more
format_list_bulleted
Related questions
Question
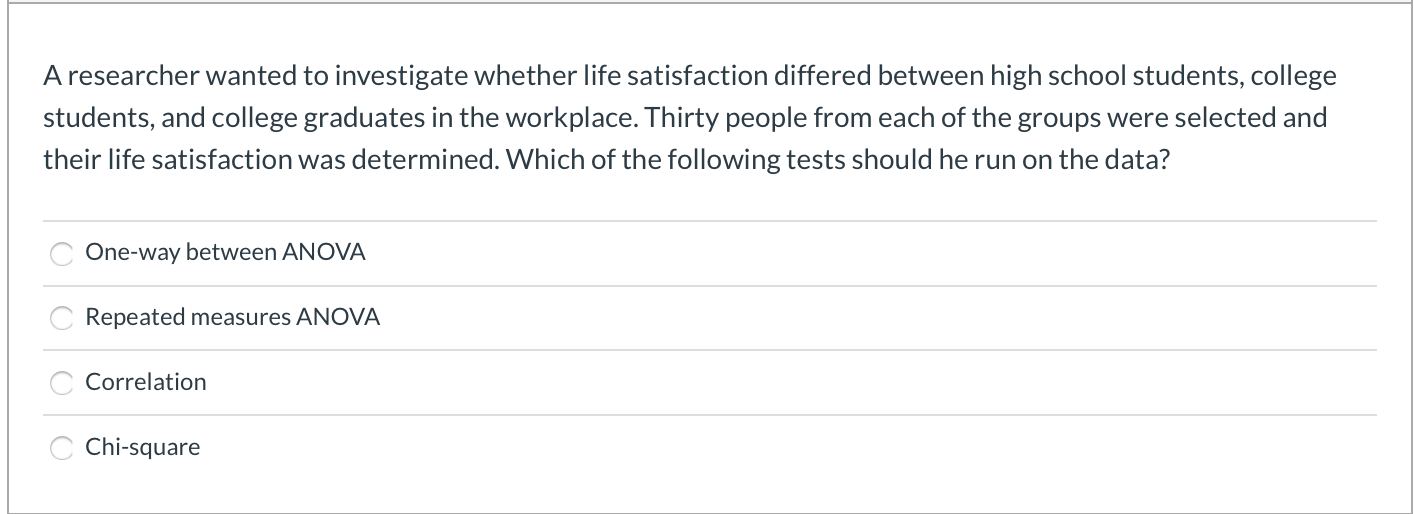

Transcribed Image Text:A researcher wanted to investigate whether life satisfaction differed between high school students, college
students, and college graduates in the workplace. Thirty people from each of the groups were selected and
their life satisfaction was determined. Which of the following tests should he run on the data?
One-way between ANOVA
Repeated measures ANOVA
Correlation
Chi-square
Expert Solution
This question has been solved!
Explore an expertly crafted, step-by-step solution for a thorough understanding of key concepts.

This is a popular solution

Trending nowThis is a popular solution!

Step by stepSolved in 3 steps

Knowledge Booster

Similar questions
- A hospital was interested in purchasing new thermometers for its Emergency Department. There were two different thermometer devices that were identified as being potentially suitable for purchase. The procurement officer asked nine Emergency Department nurses to use both thermometer devices during a shift. At the end of the shift, the officer asked them to rate how useable both devices were on a scale from 1 (not at all useable) to 7 (extremely useable). The data was non-normal. Assuming there were two zero-valued difference scores excluded from the analysis, and with an alpha level of .05, what is the critical value for the test? 2.306 2 4 3arrow_forwardAspirin prevents blood from clotting and helps prevent strokes. The Second European Stroke Prevention Study asked whether adding another anticlotting drug named dipyridamole would make a difference for patients who had already had a stroke. Here are the data on strokes during the two years of the study: Aspirin alone Apsirin & Dipyridamole Number of Patients This test is two-tailed. What is the test statistic? 200 200 # Is there a significant difference in the proportion of strokes in the two groups? Test at a = 0.10. Round your answers to three decimal places, and round any interim calculations to four decimal places. Fill in the hypotheses below where p₁ denotes the proportion of patients in the aspirin group who suffered a stroke and på denotes the proportion of patients in the aspirin & dipyridamole group who suffered a stroke. Ho: P Ha: P₁ Number of Strokes P₂ 60 P₂ 54 Part 2 ofarrow_forward= Q1. Suppose that for k = 1,..., K and i 1,...,nk we observe independent Xki ~ Np(µk, Ip), where K, n₁,...,nk € N. In this question we consider the K-sample testing problem, where we want to test the null hypothesis Ho: μ₁ = μK. Note that the observations here have identity covariance matrix, so this is a simplification of the setting found in the notes. (a) Write down the likelihood function L(µ₁,…,‚µK) for this model, and prove that -X₁²), supμERP L(μ,..., μl) L(µ₁, ´μ1,...,KERP sup =... (ii) Show that we may write .., MK) = = K ink K where X₁ = n²¹ [₁ Xki and X = N-¹Σk_₁ nķīk with N = Σk 1_1 nk. -k i=1 k=1 exp 2 k=1 (b) In this part of the question we will find the distribution of K_₁7k|Xk – X² under Hō. (i) Define the Kp-dimensional random vector Y = (√n₁×¹, ..√nKX). Give, with jus- nk tification, the distribution of Y. K Σ k=1 (c) Suppose that we have data on K observe = nk Xk (√n₁(×₁ – Ī)¹,..., √nk(Xk — X)¹)¹ = (Ikp — N−¹VV¹)Y, where V is the Kp × p matrix given by VT =…arrow_forward
- In the following situation we want to compare the mean responses in several populations.Are you a morning person, an evening person, or neither? Does this personality trait affect how well you perform? A sample of 111 students took a psychological test that found 17 morning people, 35 evening people, and 59 who were neither. All the students then took a test of their ability to memorize at 8 a.m. and again at 9 p.m. You analyze the score at 8 a.m. minus the score at 9 p.m. Give k, the ni, and N?arrow_forwardCould you please explain these questions and definitions?arrow_forwardWhich chi-square test should be used on the following study?A psychotherapist wanted to see what percentages that patients sought after four different kinds of therapy consisting of play, dance, music and group therapy. a.goodness of fit b.test of independencearrow_forward
- A researcher wants to study whether there is a relationship between type of music (pop or country) and mood (good or bad). The observed frequency table is 2x2 (two columns and two rows). Use a significance level of 5%. What is the critical value? Group of answer choices A. 11.143 B. 9.348 C. 7.378 D. 3.841arrow_forwardIn the following situation we want to compare the mean responses in several populations.Are you a morning person, an evening person, or neither? Does this personality trait affect how well you perform? A sample of 111 students took a psychological test that found 17 morning people, 35 evening people, and 59 who were neither. All the students then took a test of their ability to memorize at 8 a.m. and again at 9 p.m. You analyze the score at 8 a.m. minus the score at 9 p.m. Give the degrees of freedom of the ANOVA F test. numerator df = denominator df =arrow_forwardCalculate the relevant test statistic. Round your answer to two decimal places. t-statistic = i Find the p-value. Round your answer to three decimal places. p-value = iarrow_forward
- Does a person's letter grade in statistics depend on whether he or she is a statistics major? In three statistics classes, you collect data on the letter grades of students who are statistics majors and students who are not statistics majors. What would you use to analyze the data? a. independent-samples t test b. chi square test of independence c. Mann–Whitney U test d. Spearman rank-order correlation coefficientarrow_forwardIn the class poll from the beginning of the year, you were asked what color car you drive. The results are summarized below. aqua 3 beige/tan/gold 39 black 80 blue 44 green 21 orange 3 pink 1 purple 3 red 45 silver 63 white 74 yellow 1 What is the mode for this data set?arrow_forwardFor a sample of n=16 scores, how many scores are used to calculate the sample variance?arrow_forward
arrow_back_ios
SEE MORE QUESTIONS
arrow_forward_ios
Recommended textbooks for you
- MATLAB: An Introduction with ApplicationsStatisticsISBN:9781119256830Author:Amos GilatPublisher:John Wiley & Sons Inc
 Probability and Statistics for Engineering and th...StatisticsISBN:9781305251809Author:Jay L. DevorePublisher:Cengage Learning
 Statistics for The Behavioral Sciences (MindTap C...StatisticsISBN:9781305504912Author:Frederick J Gravetter, Larry B. WallnauPublisher:Cengage Learning
  Elementary Statistics: Picturing the World (7th E...StatisticsISBN:9780134683416Author:Ron Larson, Betsy FarberPublisher:PEARSON
 The Basic Practice of StatisticsStatisticsISBN:9781319042578Author:David S. Moore, William I. Notz, Michael A. FlignerPublisher:W. H. Freeman
 Introduction to the Practice of StatisticsStatisticsISBN:9781319013387Author:David S. Moore, George P. McCabe, Bruce A. CraigPublisher:W. H. Freeman
MATLAB: An Introduction with Applications
Statistics
ISBN:9781119256830
Author:Amos Gilat
Publisher:John Wiley & Sons Inc
Probability and Statistics for Engineering and th...
Statistics
ISBN:9781305251809
Author:Jay L. Devore
Publisher:Cengage Learning
Statistics for The Behavioral Sciences (MindTap C...
Statistics
ISBN:9781305504912
Author:Frederick J Gravetter, Larry B. Wallnau
Publisher:Cengage Learning
Elementary Statistics: Picturing the World (7th E...
Statistics
ISBN:9780134683416
Author:Ron Larson, Betsy Farber
Publisher:PEARSON
The Basic Practice of Statistics
Statistics
ISBN:9781319042578
Author:David S. Moore, William I. Notz, Michael A. Fligner
Publisher:W. H. Freeman
Introduction to the Practice of Statistics
Statistics
ISBN:9781319013387
Author:David S. Moore, George P. McCabe, Bruce A. Craig
Publisher:W. H. Freeman