
MATLAB: An Introduction with Applications
6th Edition
ISBN: 9781119256830
Author: Amos Gilat
Publisher: John Wiley & Sons Inc
expand_more
expand_more
format_list_bulleted
Related questions
Question
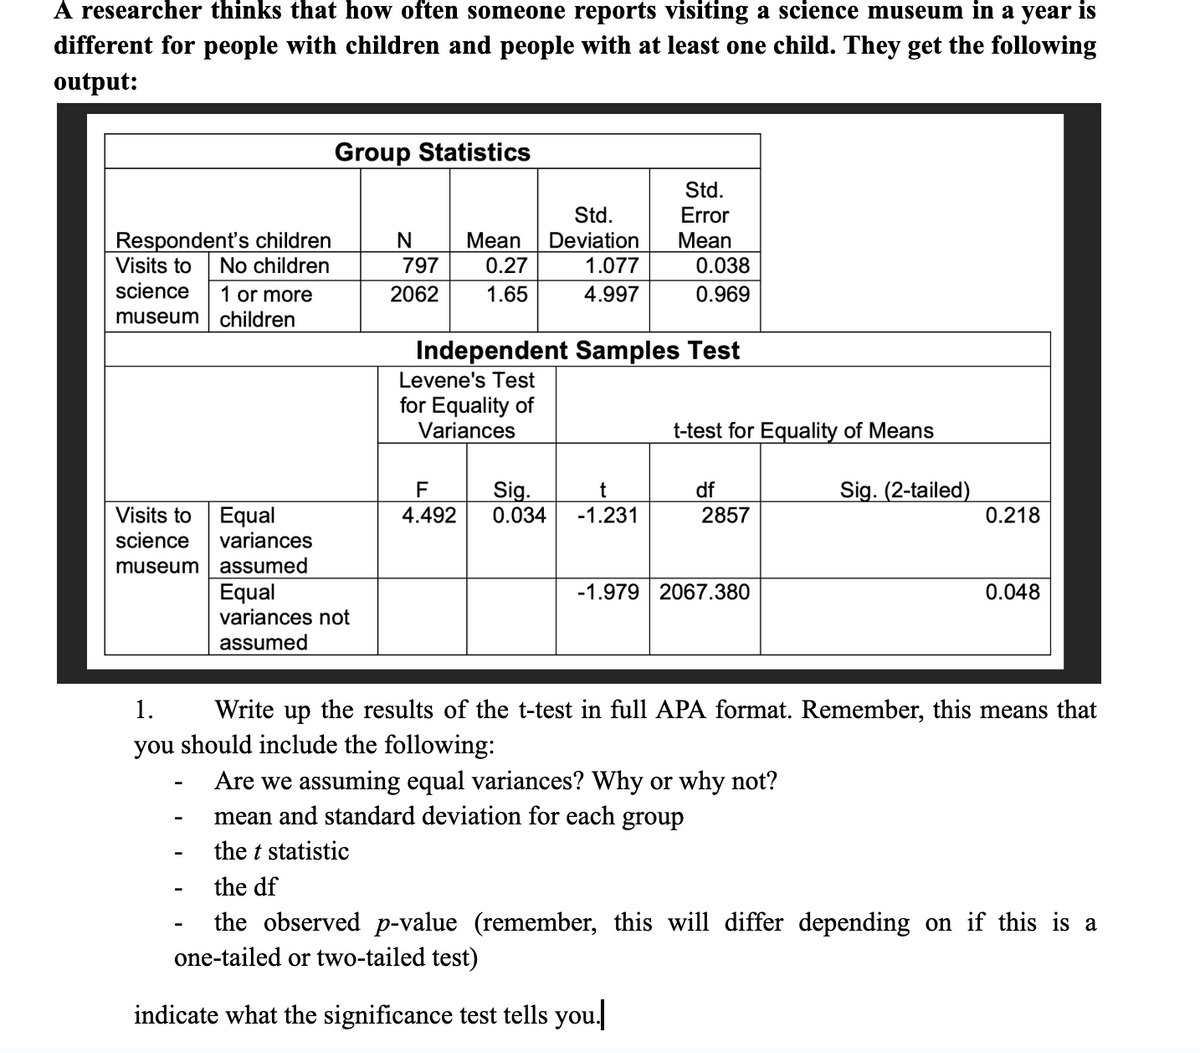

Transcribed Image Text:A researcher thinks that how often someone reports visiting a science museum in a year is
different for people with children and people with at least one child. They get the following
output:
Group Statistics
Std.
Std.
Error
Respondent's children
Visits to
No children
N
797
Mean
0.27
Deviation
Mean
1.077
0.038
science
museum
1 or more
children
2062
1.65
4.997
0.969
Independent Samples Test
Levene's Test
for Equality of
Variances
t-test for Equality of Means
F
Visits to
Equal
4.492
Sig.
0.034
t
-1.231
df
2857
Sig. (2-tailed)
0.218
science
museum
variances
assumed
Equal
-1.979 2067.380
0.048
variances not
assumed
1.
Write up the results of the t-test in full APA format. Remember, this means that
you should include the following:
-
Are we assuming equal variances? Why or why not?
-
mean and standard deviation for each group
-
the t statistic
-
the df
the observed p-value (remember, this will differ depending on if this is a
one-tailed or two-tailed test)
indicate what the significance test tells you.
SAVE
AI-Generated Solution
info
AI-generated content may present inaccurate or offensive content that does not represent bartleby’s views.
Unlock instant AI solutions
Tap the button
to generate a solution
to generate a solution
Click the button to generate
a solution
a solution
Knowledge Booster

Similar questions
- A primary measure of dispersion for sample data is the sample standard deviation, s. Choose the best option to explain what the meaning of the sample standard deviation is, in general. A. The distance between one observation and the mean. B. The average distance of an observation from the middle of the distribution. C. The average distance between observations in the sample. D. The distance between the third and first quartiles.arrow_forwardIf the population standard deviation is 9, then what is the variance? a. 9 b. 81 c. 3 d. 18arrow_forwardWhich of the following is NOT a misuse of statistics?Choose the correct answer below.A.Utilizing valid statistical methods and correct sampling techniquesB.Concluding that a variable causes another variable because they have some correlationC.Misleading graphsD.Making conclusions about a population based on a voluntary response samplearrow_forward
- A company selling a new type of laptop battery advertises that it has a méan lifetime of 5 years. If you were in charge of quality control at the factory, which one of the following standard deviations of battery life spans would you prefer? 2 months. O 2 years O 5 years 27arrow_forwardConsider the data from the Anthropology 105 class. The mean for women is 64.33 in and the standard deviation is 2.64 in. The average height of men in the US is approximately 5ft 10in. What proportion of women represented here are shorter than the average man?arrow_forwardIf the variance is 140.2, what is the Standard deviation from the following? a. 12.84 b. 15.56 c. 16.56 d. 11.84arrow_forward
- A psychologist is interested in whether working memory is influenced by sleep loss. The psychologist administers a measure of working memory to a group of subjects at 8 A.M. on day 1 of the study and then again at 8 A.M. on day 2 of the study, after keeping the subjects awake the entire night. Does sleep loss affect working memory? What statistical analysis should be performed to answer this question? Question 10 options: single-sample t test z test standard deviation analysis paired-samples t testarrow_forwardConsider the following data: −10, −10, 0, 3, −10, 3, 3 Step 1 of 3: Calculate the value of the sample Variance. Round your answer to one decimal place. Step 2 of 3: Calculate the value of the sample deviation. Round your answer to one decimal place. Step 3 of 3: Calculate the value of the range.arrow_forwardMC Qu. 10-64 Sales at a fast-food restaurant average... Sales at a fast-food restaurant average $6,000 per day. The restaurant decided to introduce an advertising campaign to Increase daily sales. In order to determine the effectiveness of the advertising campaign, a sample of 49 day's sales were taken. The sample showed average daily sales of $6,300. From past history, the restaurant knew that its population standard deviation is about $1,000. If the level of significance is 0.01, have sales increased as a result of the advertising campaign? Multiple Choice Fail to reject the null hypothesis. Reject the null hypothesis and conclude the mean is higher than $6,000 per day. Reject the null hypothesis and conclude the mean is lower than $6,000 per day. Reject the null hypothesis and conclude that mean equal to $6,000 per day.arrow_forward
arrow_back_ios
arrow_forward_ios
Recommended textbooks for you
- MATLAB: An Introduction with ApplicationsStatisticsISBN:9781119256830Author:Amos GilatPublisher:John Wiley & Sons Inc
 Probability and Statistics for Engineering and th...StatisticsISBN:9781305251809Author:Jay L. DevorePublisher:Cengage Learning
 Statistics for The Behavioral Sciences (MindTap C...StatisticsISBN:9781305504912Author:Frederick J Gravetter, Larry B. WallnauPublisher:Cengage Learning
  Elementary Statistics: Picturing the World (7th E...StatisticsISBN:9780134683416Author:Ron Larson, Betsy FarberPublisher:PEARSON
 The Basic Practice of StatisticsStatisticsISBN:9781319042578Author:David S. Moore, William I. Notz, Michael A. FlignerPublisher:W. H. Freeman
 Introduction to the Practice of StatisticsStatisticsISBN:9781319013387Author:David S. Moore, George P. McCabe, Bruce A. CraigPublisher:W. H. Freeman
MATLAB: An Introduction with Applications
Statistics
ISBN:9781119256830
Author:Amos Gilat
Publisher:John Wiley & Sons Inc
Probability and Statistics for Engineering and th...
Statistics
ISBN:9781305251809
Author:Jay L. Devore
Publisher:Cengage Learning
Statistics for The Behavioral Sciences (MindTap C...
Statistics
ISBN:9781305504912
Author:Frederick J Gravetter, Larry B. Wallnau
Publisher:Cengage Learning
Elementary Statistics: Picturing the World (7th E...
Statistics
ISBN:9780134683416
Author:Ron Larson, Betsy Farber
Publisher:PEARSON
The Basic Practice of Statistics
Statistics
ISBN:9781319042578
Author:David S. Moore, William I. Notz, Michael A. Fligner
Publisher:W. H. Freeman
Introduction to the Practice of Statistics
Statistics
ISBN:9781319013387
Author:David S. Moore, George P. McCabe, Bruce A. Craig
Publisher:W. H. Freeman