MATLAB: An Introduction with Applications
6th Edition
ISBN: 9781119256830
Author: Amos Gilat
Publisher: John Wiley & Sons Inc
expand_more
expand_more
format_list_bulleted
Question

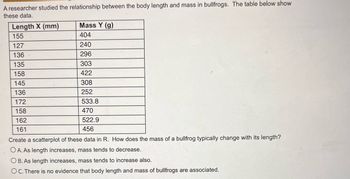
Transcribed Image Text:A researcher studied the relationship between the body length and mass in bullfrogs. The table below show
these data.
Length X (mm)
155
127
136
135
158
145
136
172
158
162
161
Mass Y (g)
404
240
296
303
422
308
252
533.8
470
522.9
456
Create a scatterplot of these data in R. How does the mass of a bullfrog typically change with its length?
OA. As length increases, mass tends to decrease.
OB. As length increases, mass tends to increase also.
OC. There is no evidence that body length and mass of bullfrogs are associated.
Expert Solution
This question has been solved!
Explore an expertly crafted, step-by-step solution for a thorough understanding of key concepts.
This is a popular solution
Trending nowThis is a popular solution!
Step by stepSolved in 2 steps with 2 images

Knowledge Booster
Similar questions
- Use the data to perform model adequacy checking, show clear calculationarrow_forwardWhich of the following is an example of ratio level data? Cars described as compact, midsize, and full-size Colors of M&M candies. O Weights of M&M candies Types of markers (washable, permanent, etc.)arrow_forwardHow strongly do physical characteristics of sisters and brothers correlate? The data in the table give the heights (in inches) of 1212 adult pairs. Brother 7171 6868 6666 6767 7070 7171 7070 7373 7272 6565 6666 7070 Sister 6969 6464 6565 6363 6565 6262 6565 6464 6666 5959 6262 6464 To access the data, click the link for your preferred software format. CSV Excel (xls) Excel (xlsx) JMP Mac-Text Minitab14-18 Minitab18+ PC-Text R SPSS TI CrunchIt! © Macmillan Learning Assume Damien is 6767 inches tall. Predict the height of his sister Tonya. Give your answer to one decimal place. Tonya's predicted height:arrow_forward
- The energy consumption of a group of studio condos is stated below. One set of condos is facing the sun while the other set is not. Determine the interquartile range in each data set and analyze the differences in context. Be sure to show all equations and calculations used. Answer in complete sentences. Facing the sun (kilowatt hours per month): 850, 700, 450, 320, 900, 1500, 456, 742, 753, 854, 1000, 547, 865 Not facing the sun (kilowatt hours per month): 950, 750, 525, 410, 990, 1640, 556, 842, 853, 954, 1150, 647, 965arrow_forwardDetermine the equation of the best fit line shown below, and use this equation to predict the arm length of a person who is 75 inches tall.arrow_forwardInterpret for the plot belowarrow_forward
- The table below shows the number of state-registered automatic weapons and the murder rate for several Northwestern states. 11.9 8.5 3.5 2.3 2.7 2.6 0.3 13.8 11.1 10 5.7 6.4 6.4 4.3 I = thousands of automatic weapons y = murders per 100,000 residents This data can be modeled by the equation y = 0.82x + 4.09. Use this equation to answer the following; Special Note: I suggest you verify this equation by performing linear regression on your calculator. A) How many murders per 100,000 residents can be expected in a state with 6 thousand automatic weapons? Answer = Round to 3 decimal places. B) How many murders per 100,000 residents can be expected in a state with 10.6 thousand automatic weapons? Answer = Round to 3 decimal places. Question Help: Video O Message instructor Submit Question 目 hp -> #3 & 4. 8. 00 %24arrow_forwardPlease answer this question. Show work! Use both pictures to answer the question.arrow_forward76 74 71 78 80 67 80 82 67 88 72 78 85 76 84 82 83 80 72 82 77 79 86 89 69 70 82 86 78 77 1. The ages of a sample of 30 people living in assisted living facilities in Columbia, South Carolina are shown in the table. Construct a dot plot for the data.arrow_forward
- Refer to the table : the number of students working 19 hours or less is: A. 80 B.180 C. 100 D. 300arrow_forwardSelect the term that correctly completes the statement. The color of hats worn by baseball players would be _______ data. A) Qualitative B) Quantitativearrow_forwardSolve the attached question and give final answers please.The question and historical data is attached.arrow_forward
arrow_back_ios
SEE MORE QUESTIONS
arrow_forward_ios
Recommended textbooks for you
 MATLAB: An Introduction with ApplicationsStatisticsISBN:9781119256830Author:Amos GilatPublisher:John Wiley & Sons Inc
 Probability and Statistics for Engineering and th...StatisticsISBN:9781305251809Author:Jay L. DevorePublisher:Cengage Learning
 Statistics for The Behavioral Sciences (MindTap C...StatisticsISBN:9781305504912Author:Frederick J Gravetter, Larry B. WallnauPublisher:Cengage Learning
 Elementary Statistics: Picturing the World (7th E...StatisticsISBN:9780134683416Author:Ron Larson, Betsy FarberPublisher:PEARSON
 The Basic Practice of StatisticsStatisticsISBN:9781319042578Author:David S. Moore, William I. Notz, Michael A. FlignerPublisher:W. H. Freeman
 Introduction to the Practice of StatisticsStatisticsISBN:9781319013387Author:David S. Moore, George P. McCabe, Bruce A. CraigPublisher:W. H. Freeman

MATLAB: An Introduction with Applications
Statistics
ISBN:9781119256830
Author:Amos Gilat
Publisher:John Wiley & Sons Inc

Probability and Statistics for Engineering and th...
Statistics
ISBN:9781305251809
Author:Jay L. Devore
Publisher:Cengage Learning

Statistics for The Behavioral Sciences (MindTap C...
Statistics
ISBN:9781305504912
Author:Frederick J Gravetter, Larry B. Wallnau
Publisher:Cengage Learning

Elementary Statistics: Picturing the World (7th E...
Statistics
ISBN:9780134683416
Author:Ron Larson, Betsy Farber
Publisher:PEARSON

The Basic Practice of Statistics
Statistics
ISBN:9781319042578
Author:David S. Moore, William I. Notz, Michael A. Fligner
Publisher:W. H. Freeman

Introduction to the Practice of Statistics
Statistics
ISBN:9781319013387
Author:David S. Moore, George P. McCabe, Bruce A. Craig
Publisher:W. H. Freeman