MATLAB: An Introduction with Applications
6th Edition
ISBN: 9781119256830
Author: Amos Gilat
Publisher: John Wiley & Sons Inc
expand_more
expand_more
format_list_bulleted
Question

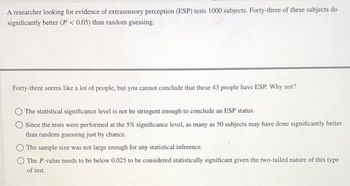
Transcribed Image Text:A researcher looking for evidence of extrasensory perception (ESP) tests 1000 subjects. Forty-three of these subjects do
significantly better (P < 0.05) than random guessing.
Forty-three seems like a lot of people, but you cannot conclude that these 43 people have ESP. Why not?
The statistical significance level is not be stringent enough to conclude an ESP status.
Since the tests were performed at the 5% significance level, as many as 50 subjects may have done significantly better
than random guessing just by chance.
The sample size was not large enough for any statistical inference.
The P-value needs to be below 0.025 to be considered statistically significant given the two-tailed nature of this type
of test.

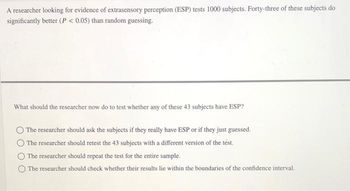
Transcribed Image Text:A researcher looking for evidence of extrasensory perception (ESP) tests 1000 subjects. Forty-three of these subjects do
significantly better (P < 0.05) than random guessing.
What should the researcher now do to test whether any of these 43 subjects have ESP?
The researcher should ask the subjects if they really have ESP or if they just guessed.
The researcher should retest the 43 subjects with a different version of the test.
The researcher should repeat the test for the entire sample.
The researcher should check whether their results lie within the boundaries of the confidence interval.
Expert Solution
This question has been solved!
Explore an expertly crafted, step-by-step solution for a thorough understanding of key concepts.
This is a popular solution
Trending nowThis is a popular solution!
Step by stepSolved in 4 steps

Knowledge Booster
Similar questions
- Researchers wish to study the effect of daily brain teasers on a person's intelligence. The researchers randomly choose 20 students from their local college campus. Day one of the test, every student is given an IQ test. The students are then randomly divided into Group A and Group B (10 students each). Group A is given daily brain teasers, while Group B were not instructed to participate in anything outside their normal routine. At the end of a 30 day period, each member of the group takes an IQ test. The students are aware of what group they are in, but the researchers have no idea until the results are given. The test given to Group A would be considered the Control Treatment Variable Placeboarrow_forwardThe effects of social skill training on a 29 year-old mentally retarded male adult were explored. The subject listened to typical social situations (such as getting a compliment or saying thank you) on audiotape and discussed the situations with a therapist. The subject's positive social verbal interactions were counted before the training, at three times during the training period, and at three times after the training had been completed. All counts were taken by observing the subject at a evening recreation time in the subject's group home. Results show that positive interactions increased during the training period but then rapidly decreased after training had stopped. Independent variable (construct): Levels (operational def): Organismic/Manipulated: B/W or W/I: Dependent variable (Construct & Operational def): Type of Hypothesis: Type of Statistic: Research Design:arrow_forwardIs the proportion of wildfires caused by humans in the south higher than the proportion of wildfires caused by humans in the west? 348 of the 574 randomly selected wildfires looked at in the south were caused by humans while 272 of the 518 randomly selected wildfires looked at the west were caused by humans. What can be concluded at the = 0.01 level of significance? a. For this study, we should use Select an answer b. The null and alternative hypotheses would be: Ho: Select an answer Select an answer Select an answer (please enter a decimal) H₁: Select an answer Select an answer Select an answer (Please enter a decimal) = c. The test statistic ? ◊ your answer to 3 decimal places.) (please showarrow_forward
- How would you find (a.) and (b.)?? As well as finding the test statistic and p-value?arrow_forwardAccording to the Minnesota Baccalaureate Psychomotor Skills Test (2008) your patient has significantly greater psychomotor skills than the average patient. Which of the following results would be appropriate to see with this finding? a-Z=1.36 (p=0.01) b-Z=5.67(p=0.08) c-Fail to reject the null d-Z= -1.98 (p=0.02) why is the answer a? and what is a trick to remember with p values? i understand that it is 0.05 or 5% chance of errorarrow_forwardA researcher takes a sample of 50 individuals and administers a background check to identify the number of prior arrests for each person. For whatever reason, one person is removed from the analysis and another random person is selected to replace that person. Having no additional information, what is your best guess of the number of prior arrests experienced by the replacement person? Why?arrow_forward
- There are many ways to measure the reading ability of children. Research designed toimprove reading performance is dependent on good measures of the outcome. Onefrequently used test is the DRP, or Degree of Reading Power. A researcher suspects that themean score µ of all third- graders in Henrico County Schools is different from the nationalmean, which is 32. To test her suspicion, she administers the DRP to an SRS of 44 HenricoCounty third-grade students. The distribution of scores is summarized in the Minitab outputbelow: MEAN STDEV SEMEAN MIN Q1 MEDIAN Q3MAXDRP 35.09 11.19 1.69 14.00 26.00 35.00 44.0054.00 Construct a 90% confidence interval to estimate the mean DRP score in Henrico CountySchools.arrow_forwardDoes the source of medical information affect people’s confidence that it is true? To answer this question, you presented medical information to participants regarding the importance of vaccinations. Participants were randomly assigned to read medical information from a doctor, a politician, or a celebrity. Then, they indicated how confident they were that the information is true.arrow_forwardA dowser has correctly located water for a well 1 out of 2 times in Jones County. In Jones County, someone who is just guessing has a 40% chance of locating water for a well. Does this sample provide sufficient evidence that the dowser can locate water and is not just guessing?arrow_forward
- The General Social Survey is an annual survey given to about 1500 U.S. adults selected at random. A recent survey contained the question "How important to your life is having a fulfilling job?" Of the 267 college graduates surveyed, 106 chose the response "Very important." Of the 113 people surveyed whose highest level of education was high school or less, 59 chose the response "Very important." Based on these data, can we conclude, at the 0.05 level of significance, that there is a difference between the proportion p1 of all U.S. college graduates who would answer "Very important" and the proportion p2 of all U.S. adults whose highest level of education was high school or less who would answer "Very important"?Perform a two-tailed test. Then complete the parts below.Carry your intermediate computations to three or more decimal places and round your answers as specified in the parts below. (If necessary, consult a list of formulas.) A. Find the value of the test statistic and round to…arrow_forwardDue to a consumer protection law which penalizes manufacturers if their products are under filled (contains less than the advertised amount), some manufacturers deliberately overfill slightly. For example, the label on the container of Morton Iodized Salt shows its volume to be 26 ounces. Suppose the distribution of volumes of salt is approximately normal with a mean 26.9 ounces and a standard deviation of 0.51 ounces. Find the probability a randomly selected container has at most 26.0 ounces. Express the answer as a decimal value rounded to the nearest thousandth.arrow_forward
arrow_back_ios
arrow_forward_ios
Recommended textbooks for you
 MATLAB: An Introduction with ApplicationsStatisticsISBN:9781119256830Author:Amos GilatPublisher:John Wiley & Sons Inc
 Probability and Statistics for Engineering and th...StatisticsISBN:9781305251809Author:Jay L. DevorePublisher:Cengage Learning
 Statistics for The Behavioral Sciences (MindTap C...StatisticsISBN:9781305504912Author:Frederick J Gravetter, Larry B. WallnauPublisher:Cengage Learning
 Elementary Statistics: Picturing the World (7th E...StatisticsISBN:9780134683416Author:Ron Larson, Betsy FarberPublisher:PEARSON
 The Basic Practice of StatisticsStatisticsISBN:9781319042578Author:David S. Moore, William I. Notz, Michael A. FlignerPublisher:W. H. Freeman
 Introduction to the Practice of StatisticsStatisticsISBN:9781319013387Author:David S. Moore, George P. McCabe, Bruce A. CraigPublisher:W. H. Freeman

MATLAB: An Introduction with Applications
Statistics
ISBN:9781119256830
Author:Amos Gilat
Publisher:John Wiley & Sons Inc

Probability and Statistics for Engineering and th...
Statistics
ISBN:9781305251809
Author:Jay L. Devore
Publisher:Cengage Learning

Statistics for The Behavioral Sciences (MindTap C...
Statistics
ISBN:9781305504912
Author:Frederick J Gravetter, Larry B. Wallnau
Publisher:Cengage Learning

Elementary Statistics: Picturing the World (7th E...
Statistics
ISBN:9780134683416
Author:Ron Larson, Betsy Farber
Publisher:PEARSON

The Basic Practice of Statistics
Statistics
ISBN:9781319042578
Author:David S. Moore, William I. Notz, Michael A. Fligner
Publisher:W. H. Freeman

Introduction to the Practice of Statistics
Statistics
ISBN:9781319013387
Author:David S. Moore, George P. McCabe, Bruce A. Craig
Publisher:W. H. Freeman