MATLAB: An Introduction with Applications
6th Edition
ISBN: 9781119256830
Author: Amos Gilat
Publisher: John Wiley & Sons Inc
expand_more
expand_more
format_list_bulleted
Question

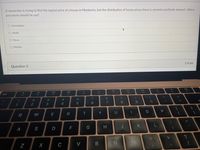
Transcribed Image Text:A researcher is trying to find the typical price of a house in Montecito, but the distribution of house prices there is severely positively skewed. Which
procedure should he use?
O Correlation
O Mode
O Mean
O Median
Question 3
1.4 pts
MacBook Air
80
888
DD
esc
F1
F2
F3
F5
F6
F7
F10
2$
&
10
2
3
4.
6.
7
%3D
W
E
R
Y
U
P
11
D
F
G
K
C
V
.. .-
Expert Solution
This question has been solved!
Explore an expertly crafted, step-by-step solution for a thorough understanding of key concepts.
Step by stepSolved in 2 steps

Knowledge Booster
Similar questions
- In each of Exercises, use the technology of your choice to decide whether you can reasonably apply the correlation t-test. If so, perform and interpret the required correlation t-test(s) at the 5% significance level.Shortleaf Pines. The data from Exercise for volume, in cubic feet, and diameter at breast height, in inches, of 70 shortleaf pines are on the WeissStats site. Do the data provide sufficient evidence to conclude that diameter at breast height and volume are positively linearly correlated for shortleaf pines?ExerciseWorking with Large Data SetsIn Exercises, use the technology of your choice toa. obtain and interpret the standard error of the estimate.b. obtain a residual plot and a normal probability plot of the residuals.c. decide whether you can reasonably consider Assumptions 1–3 for regression inferences met by the two variables under consideration.Shortleaf Pines. The ability to estimate the volume of a tree based on a simple measurement, such as the diameter of the…arrow_forwardplease answer in text form and in proper format answer with must explanation , calculation for each part and steps clearlyarrow_forwardProvide an example scenario for which you would use ANOVA and explain what the calculated F value tells us.arrow_forward
- Are the observed frequencies variables? What about the expected frequencies? Explain your answers.arrow_forwardWhile performing searches on the Internet to find accommodation, Jasmine realized that the cost of a housing unit seems to be related to the number of inhabitants of the municipality where the unit is located. She noted the following data. She represented the data in a scatter plot, where she drew a line of best fit passing through the mean point of the distribution. If Jasmine considers that a linear correlation exists between these two variables, what should be the mean monthly rent of a 4½-room unit in a municipality with a population of approximately 250 000? Justify your answer algebraically.arrow_forwardPlease help it’s not gradedarrow_forward
- Exercise 6. Regression Fallacy. Historically, scores on the two midterms had a correlation of 0.48. Suppose that Jeri scored 2.1 standard deviations below the mean on the first midterm. (a) How many standard deviations [above or below?] the mean would you predict for her second midterm?arrow_forwardplease complete the blank problem and or ones with a red x next to it not ones with a green check next to pleasearrow_forwardMean = 5.2 Median=3 Mode= 2 Graph what the distribution would look like. Is it normally distributed? If not, how is it skewed and what might cause this type of skew to the distribution?arrow_forward
arrow_back_ios
SEE MORE QUESTIONS
arrow_forward_ios
Recommended textbooks for you
 MATLAB: An Introduction with ApplicationsStatisticsISBN:9781119256830Author:Amos GilatPublisher:John Wiley & Sons Inc
 Probability and Statistics for Engineering and th...StatisticsISBN:9781305251809Author:Jay L. DevorePublisher:Cengage Learning
 Statistics for The Behavioral Sciences (MindTap C...StatisticsISBN:9781305504912Author:Frederick J Gravetter, Larry B. WallnauPublisher:Cengage Learning
 Elementary Statistics: Picturing the World (7th E...StatisticsISBN:9780134683416Author:Ron Larson, Betsy FarberPublisher:PEARSON
 The Basic Practice of StatisticsStatisticsISBN:9781319042578Author:David S. Moore, William I. Notz, Michael A. FlignerPublisher:W. H. Freeman
 Introduction to the Practice of StatisticsStatisticsISBN:9781319013387Author:David S. Moore, George P. McCabe, Bruce A. CraigPublisher:W. H. Freeman

MATLAB: An Introduction with Applications
Statistics
ISBN:9781119256830
Author:Amos Gilat
Publisher:John Wiley & Sons Inc

Probability and Statistics for Engineering and th...
Statistics
ISBN:9781305251809
Author:Jay L. Devore
Publisher:Cengage Learning

Statistics for The Behavioral Sciences (MindTap C...
Statistics
ISBN:9781305504912
Author:Frederick J Gravetter, Larry B. Wallnau
Publisher:Cengage Learning

Elementary Statistics: Picturing the World (7th E...
Statistics
ISBN:9780134683416
Author:Ron Larson, Betsy Farber
Publisher:PEARSON

The Basic Practice of Statistics
Statistics
ISBN:9781319042578
Author:David S. Moore, William I. Notz, Michael A. Fligner
Publisher:W. H. Freeman

Introduction to the Practice of Statistics
Statistics
ISBN:9781319013387
Author:David S. Moore, George P. McCabe, Bruce A. Craig
Publisher:W. H. Freeman