
MATLAB: An Introduction with Applications
6th Edition
ISBN: 9781119256830
Author: Amos Gilat
Publisher: John Wiley & Sons Inc
expand_more
expand_more
format_list_bulleted
Related questions
Question
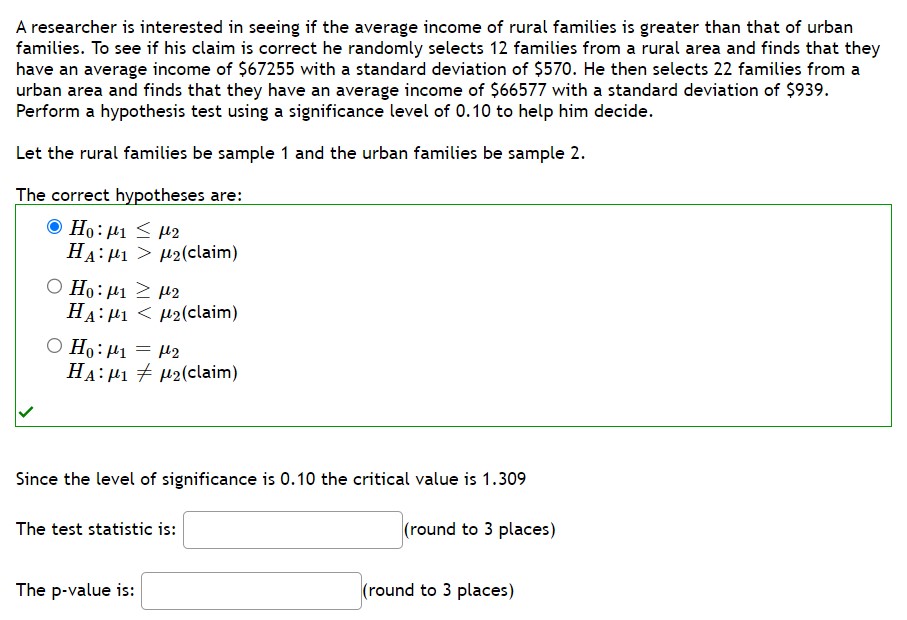

Transcribed Image Text:A researcher is interested in seeing if the average income of rural families is greater than that of urban
families. To see if his claim is correct he randomly selects 12 families from a rural area and finds that they
have an average income of $67255 with a standard deviation of $570. He then selects 22 families from a
urban area and finds that they have an average income of $66577 with a standard deviation of $939.
Perform a hypothesis test using a significance level of 0.10 to help him decide.
Let the rural families be sample 1 and the urban families be sample 2.
The correct hypotheses are:
Ho: 1 ≤ 2
HA:μι > μ2(claim)
Ο Ηο: μι 2 μ2
HAM12(claim)
O Ho: 1 = ₂
HA: 12(claim)
Since the level of significance is 0.10 the critical value is 1.309
(round to 3 places)
The test statistic is:
The p-value is:
(round to 3 places)
Expert Solution
This question has been solved!
Explore an expertly crafted, step-by-step solution for a thorough understanding of key concepts.

Step by stepSolved in 2 steps with 1 images

Knowledge Booster

Similar questions
- A hospital president claims that the average Salary of registered nurses at her hospital is more than $57,000. You test this claim by surveying 37 registered nurses at this hospital and find they have a mean salary of $57,425. Assume the population standard deviation is $1750 at the 0.10 level of significance is there enough evidence to support the claim of the hospital president?arrow_forwardThe National Coalition on Healthcare suggests that the mean annual premium that a health insurer charges an employer for a health plan covering a family of four averaged $13,000 in 2009. A sample of 30 families of four yields a mean annual premium paid by their employer to be $13,500 with a sample standard deviation of $300. We are interested in whether the mean annual premium that a health insurer charges an employer for a health plan covering a family of four is different from $13,000 using a significance level of 0.10. Select one: a. tdata = 9.129, do not reject Ho. b. tdata = 9.129, reject Ho. c. tdata = -9.129, do not reject Ho. O d. tdata = 4.156, reject Ho.arrow_forwardNebNas manages the credit department for a grocery store chain in the province, and she would like to determine whether the mean monthly balance of credit card holders is equal to $95. A random sample of 100 accounts indicated that the mean owed is $101.5 with a sample standard deviation of $25.6. If she wanted to test whether the mean balance is different from $95 and decided to reject the null hypothesis, what will be the p-value of the test?arrow_forward
- a small company is looking to see if they have reached their goal of $30.20, in saving per family. To see if goal was met their goal they randomly surveyed 50 of their 1000 customers, found that they saved average of $32.12 with a standard deviation of $4.83. Have they attained their saving goal.arrow_forwardAnn recently switched her primary doctor to one specializing in caring for elderly patients. On her new doctor's website, it says that the mean systolic blood pressure among elderly females is 120 millimeters of mercury ( mmHg ). Ann believes the value is actually higher. She bases her belief on a recently reported study of 10 randomly selected, elderly females. The sample mean systolic blood pressure was 128 mmHg , and the sample standard deviation was 25 mmHg . Assume that the systolic blood pressures of elderly females are approximately normally distributed. Based on the study, at the 0.10 level of significance, can it be concluded that μ , the population mean systolic blood pressure among elderly females, is greater than 120 mmHg ? Perform a one-tailed test. Then complete the parts below. Carry your intermediate computations to three or more decimal places. (If necessary, consult a list of formulas.) (a) State the null hypothesis H0 and the…arrow_forwardA local business offers test-taking courses for students who are planning to take the Graduate Record Examination (GRE) as part of their graduate school applications. The business promises to produce student test scores that are above the national average. You collect a random sample of 75 local students who have taken the course and calculate that their average GRE score is 1630 with a standard deviation of 320. The average GRE score for all students in the nation is 1590. Conduct a significance test at a=.05 to answer the research question: Does the course significantly improve local student GRE scores? What are the test requirements/assumptions for this significance test? Check all that apply. Random Sample Normal Sampling Distribution Interval-ratio variable of GRE scores With an alpha of .05, what is your critical score?arrow_forward
- Fran is training for her first marathon, and she wants to know if there is a significant difference between the mean number of miles run each week by group runners and individual runners who are training for marathons. She interviews 42 randomly selected people who train in groups and finds that they run a mean of 47.1 miles per week. Assume that the population standard deviation for group runners is known to be 4.4 miles per week. She also interviews a random sample of 47 people who train on their own and finds that they run a mean of 48.5 miles per week. Assume that the population standard deviation for people who run by themselves is 1.8 miles per week. Test the claim at the 0.01 level of significance. Let group runners training for marathons be Population 1 and let individual runners training for marathons be Population 2. Step 2 of 3 : Compute the value of the test statistic. Round your answer to two decimal places.arrow_forwardA study was being conducted to see if people who have no college degree have a lower mean salary than those who do have a college degree. A random sample of 70 people with no college degree was taken and their mean salary was $36,950 with a standard deviation of $4,375. A random sample of 75 people with a college degree was taken and their mean salary was $41,520 with a standard deviation of $3,415. Determine the appropriate formula and calculator function that would be used to test the claim that people with no college degree have a lower mean salary at the α = 0.05 level of significance. d T-Test sa/√n Fo Zo to = 2- SampFTest P1-P₂ 1 1 √p(1-6), + n₁ n₂ (₁-x₂)-(H₁-H₂) 51 $2 + n₁ n₂ 2-PropZTest 2-SampTTestarrow_forwardAn article in a local town newspaper discusses the results of state test scores in their town. The reporter headlines, "The students in this town don't have the necessary skills. The overall student population is less than what is reported at the state level" The state test says that a score of 261 or higher on its test reflects the student has the skills needed to graduate. A local town newspaper conducted a random sample of 200 students and found the mean to be 257 and a standard deviation of 41 points. a. State the null (H0) and alternative (Ha) hypotheses. b. Give the standard score for the data. c. Find the P-value for this significance test. e. Sketch your results on the standard Normal distribution f. Summarize the conclusion in the context of this problem.arrow_forward
- Rhys is a quality control manager at a facility that manufactures snack foods. He is interested in the number of whole mini- pretzels that are in the 10 oz bags in the latest lot produced. Rhys selects 24 bags of mini-pretzels at random from the latest lot and counts the number of pretzels in each bag His sample has a mean of 158 pretzels with a standard deviation of 1.6 pretzels. What is the margin of error with 95% confidence (2 = 2.07)? O 0.02 O 66.76 O 0.68 O 6.34arrow_forwardA local business offers test-taking courses for students who are planning to take the Graduate Record Examination (GRE) as part of their graduate school applications. The business promises to produce student test scores that are above the national average. You collect a random sample of 75 local students who have taken the course and calculate that their average GRE score is 1630 with a standard deviation of 320. The average GRE score for all students in the nation is 1590. Conduct a significance test at a=.05 to answer the research question: Does the course significantly improve local student GRE scores? STEP ONE: What are the test requirements/assumptions for this significance test? Check all that apply. Group of answer choices a) Random Sample b) Normal Sampling Distribution c) Interval-ratio variable of GRE scores d) No answer text provided.arrow_forwardLast year, the average amount that teams for the Statistics Games raised was $375. Have teams been more successful at fundraising this year? To find out, you take a random sample of 36 teams. Your sample of 36 teams yields a mean of $396 and a standard deviation of $70. Might you have made a Type 1 or Type 2 error? A Type 1. This means that we said that the mean amount raised had increased, when it was actually still $375. B You might have made a calculation error. C Neither- we're sure the average has increased. D Type 2. This would mean that we said there was not enough evidence to say the mean had increased from $375, when it actually is higher than $375. E Either kind is possible!arrow_forward
arrow_back_ios
SEE MORE QUESTIONS
arrow_forward_ios
Recommended textbooks for you
- MATLAB: An Introduction with ApplicationsStatisticsISBN:9781119256830Author:Amos GilatPublisher:John Wiley & Sons Inc
 Probability and Statistics for Engineering and th...StatisticsISBN:9781305251809Author:Jay L. DevorePublisher:Cengage Learning
 Statistics for The Behavioral Sciences (MindTap C...StatisticsISBN:9781305504912Author:Frederick J Gravetter, Larry B. WallnauPublisher:Cengage Learning
  Elementary Statistics: Picturing the World (7th E...StatisticsISBN:9780134683416Author:Ron Larson, Betsy FarberPublisher:PEARSON
 The Basic Practice of StatisticsStatisticsISBN:9781319042578Author:David S. Moore, William I. Notz, Michael A. FlignerPublisher:W. H. Freeman
 Introduction to the Practice of StatisticsStatisticsISBN:9781319013387Author:David S. Moore, George P. McCabe, Bruce A. CraigPublisher:W. H. Freeman
MATLAB: An Introduction with Applications
Statistics
ISBN:9781119256830
Author:Amos Gilat
Publisher:John Wiley & Sons Inc
Probability and Statistics for Engineering and th...
Statistics
ISBN:9781305251809
Author:Jay L. Devore
Publisher:Cengage Learning
Statistics for The Behavioral Sciences (MindTap C...
Statistics
ISBN:9781305504912
Author:Frederick J Gravetter, Larry B. Wallnau
Publisher:Cengage Learning
Elementary Statistics: Picturing the World (7th E...
Statistics
ISBN:9780134683416
Author:Ron Larson, Betsy Farber
Publisher:PEARSON
The Basic Practice of Statistics
Statistics
ISBN:9781319042578
Author:David S. Moore, William I. Notz, Michael A. Fligner
Publisher:W. H. Freeman
Introduction to the Practice of Statistics
Statistics
ISBN:9781319013387
Author:David S. Moore, George P. McCabe, Bruce A. Craig
Publisher:W. H. Freeman