
MATLAB: An Introduction with Applications
6th Edition
ISBN: 9781119256830
Author: Amos Gilat
Publisher: John Wiley & Sons Inc
expand_more
expand_more
format_list_bulleted
Related questions
Question
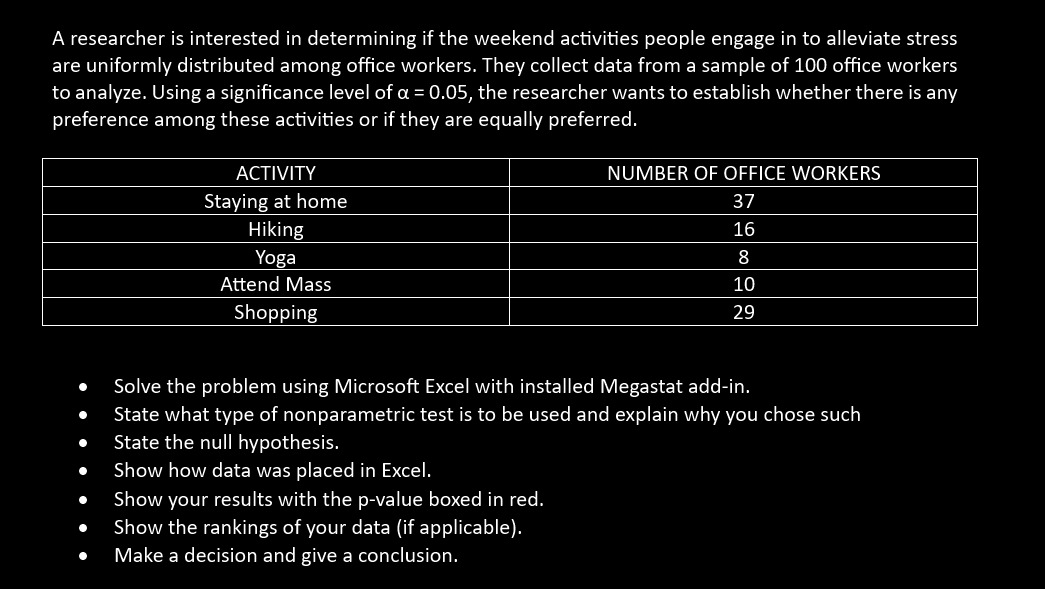

Transcribed Image Text:A researcher is interested in determining if the weekend activities people engage in to alleviate stress
are uniformly distributed among office workers. They collect data from a sample of 100 office workers
to analyze. Using a significance level of a = 0.05, the researcher wants to establish whether there is any
preference among these activities or if they are equally preferred.
●
●
●
●
●
●
ACTIVITY
Staying at home
Hiking
Yoga
Attend Mass
Shopping
NUMBER OF OFFICE WORKERS
37
16
8
10
29
Solve the problem using Microsoft Excel with installed Megastat add-in.
State what type of nonparametric test is to be used and explain why you chose such
State the null hypothesis.
Show how data was placed in Excel.
Show your results with the p-value boxed in red.
Show the rankings of your data (if applicable).
Make a decision and give a conclusion.
Expert Solution
This question has been solved!
Explore an expertly crafted, step-by-step solution for a thorough understanding of key concepts.

Step by stepSolved in 8 steps with 2 images

Knowledge Booster

Similar questions
- The table below summarizes data from a survey of a sample of women. Using a 0.01 significance level, and assuming that the sample sizes of 900 men and 400 women are predetermined, test the claim that the proportions of agree/disagree responses are the same for subjects interviewed by men and the subjects interviewed by women. Does it appear that the gender of the interviewer affected the responses of women? Gender of Interviewer Man Woman Women who agree 625 330 Women who disagree 275 70 Compute the test statistic, rounding to three decimal places. Find the critical value(s). (Round to three decimal places) What is the conclusion based on the hypothesis test?arrow_forwardYou may need to use the appropriate technology to answer this question. The better-selling candies are often high in calories. Assume that the following data show the calorie content from samples of M&M's, Kit Kat, and Milky Way candies. M&M's Kit Kat Milky Way 250 245 200 210 205 208 220 235 202 240 215 190 250 230 180 Test for significant differences among the calorie content of these three candies. State the null and alternative hypotheses. H0: All populations of calories are identical.Ha: Not all populations of calories are identical.H0: Not all populations of calories are identical.Ha: All populations of calories are identical. H0: MedianMM ≠ MedianKK ≠ MedianMWHa: MedianMM = MedianKK = MedianMWH0: MedianMM = MedianKK = MedianMWHa: MedianMM > MedianKK > MedianMWH0: MedianMM = MedianKK = MedianMWHa: MedianMM ≠ MedianKK ≠ MedianMW Find the value of the test statistic. (Round your answer to two decimal places.) Find the p-value. (Round your answer…arrow_forwardCourse/Year 1. Brian, a college administrator, claimed that there was no difference in averages of students coming from three nearby schools A, B, and C. Use the following data to test his claim with a 1% significance level. Ex A-420 2x² 253 Ex B 340 SANOVA Table: 4 Source of Variation Between - column Within - column Total A A. Ho: B. a: 0.01 C. B C 3 _M₁ = M₁₂₁ = M²3 Sum of Squares 2.25 Compute for sum of squares D. Compute for degrees of freedom 84 88 88 E. Compute for mean sum of squares F. Compute for F-value 82 83 80 df 2 Ha: STUDENTS 89 82 89 Mean Sum of Squares 85 83 80 F-value Mr & Mr & M²₂ n₁ = √=n²₁₂₁ = 3 - N = 12 7 Critical Value / Tabular Value Decisionarrow_forward
- Investigation 3.2: Valence Differences Between R&B and Rap Genres (Paired)A music fan claims that R&B songs tend to have a more positive tone on average than do Rapsongs. The individual collected two independent random samples from the population of SpotifySongs. Fifteen R&B songs and another fifteen Rap songs were collected and their Valence wasrecorded. The music fan believed that pairing the song by their Danceability may provideadditional information. Danceability describes how suitable a track is for dancing based on acombination of musical elements including tempo, rhythm stability, beat strength, and overallregularity. A value of 0.0 is least danceable and 1 is most danceable. Thus, the individual pairedthe R&B song with the lowest danceability with the Rap song with the lowest danceability,followed by the second and second, third and third. She continued this process until the R&Bsong with the highest danceability was paired with the Rap song with the…arrow_forwardThe table below summarizes data from a survey of a sample of women. Using a 0.05 significance level, and assuming that the sample sizes of 800 men and 400 women are predetermined, test the claim that the proportions of agree/disagree responses are the same for subjects interviewed by men and the subjects interviewed by women. Does it appear that the gender of the interviewer affected the responses of women? Gender of Interviewer Man Woman Women who agree 535 344 Women who disagree 265 56 Click here to view the chi-square distribution table. LOADING... Identify the null and alternative hypotheses. Choose the correct answer below. A. H0: The proportions of agree/disagree responses are different for the subjects interviewed by men and the subjects interviewed by women. H1: The proportions are the same. B. H0: The proportions of agree/disagree…arrow_forwardYou may need to use the appropriate technology to answer this question. The better-selling candies are often high in calories. Assume that the following data show the calorie content from samples of M&M's, Kit Kat, and Milky Way II. M&M's Kit Kat Milky Way II 250 245 200 210 205 208 230 215 202 220 225 190 250 240 180 Test for significant differences among the calorie content of these three candies. State the null and alternative hypotheses. O H,: Median MM * Mediank * Median ww KK H: Median MM = Mediangk = MedianMw "KK O Ho: Median MM = MedianKK H: Median MM * Median KK * MedianyW Median Mw O Ho: All populations of calories are identical. H: Not all populations of calories are identical. O Ho: Not all populations of calories are identical. H: All populations of calories are identical. O Ho: Median MM = Mediank = MedianMw H: Median MM > Mediankk > Median Mw Find the value of the test statistic. (Round your answer to two decimal places.) Find the p-value. (Round your answer to three…arrow_forward
- Time Spent Studying and Social Mediaarrow_forward5t. A magazine reports that women trust recommendations from a particular social networking site more than recommendations from any other social network platform. But does trust in this social networking site differ by gender? The following sample data show the number of women and men who stated in a recent sample that they trust recommendations made on this particular social networking site. Women Men Sample 150 170 Trust RecommendationsMade on the social networking site 111 102 (a) What is the point estimate of the proportion of women who trust recommendations made on this particular social networking site? (b) What is the point estimate of the proportion of men who trust recommendations made on this particular social networking site? (c) Provide a 95% confidence interval estimate of the difference between the proportion of women and men who trust recommendations made on this particular social networking site. (Round your answers to four decimal places.)arrow_forwardAnswer j and karrow_forward
- The better-selling candies are often high in calories. Assume that the following data show the calorie content from samples of M&M's, Kit Kat, and Milky Way II. M&M's Kit Kat Milky Way II 240 235 200 210 205 208 220 245 202 250 215 190 240 230 180 Test for significant differences among the calorie content of these three candies. State the null and alternative hypotheses. O H: MedianMM - MedianK = Median Mw H: Median MM * MedianKK + MedianMw O Ho: MedianMM = MediankK = Median Mw H: Median MM > Median KK > MedianMw O H.: Not all populations of calories are identical. H: All populations of calories are identical. O Ho: All populations of calories are identical. H: Not all populations of calories are identical. O Ho: MedianMM * MedianKk + MedianMw 'MW H: MedianMM = Mediankk = MedianMw Find the value of the test statistic. (Round your answer to two decimal places.) 8.62 Find the p-value. (Round your answer to three decimal places.) p-value =.005 At a 0.05 level of significance, what is your…arrow_forwardA random sample of 13 men and 19 women in a college class reported their grade point averages (GPAS). A woman in the class says that she believes that college women tend to have higher GPAS than do college men. Does this sample support her claim? Histogram of HGPA Histogram al WGPA 13 20 25 10 as 125 Summary statistics for these data are: 2.898 0.583 Women 3.330 | 0.395 Men What is the test statistic? [Enter t score to 2 decimal places] * Your answer Create and interpret a 95% confidence interval. Enter the low value of confidence interval to four decimal places. Your answer Enter the high value of confidence interval to four decimal places. Your answerarrow_forwardAn observational study of teams fishing for the red spiny lobster in a certain body of water was conducted and the results published in a science magazine. One of the variables of interest was the average distance separating traps - called "trap spacing" - deployed by the same team of fishermen. Trap spacing measurements (in meters) for a sample of seven teams of fishermen are shown in the accompanying table. Of interest is the mean trap spacing for the population of red spiny lobster fishermen fishing in this body of water. Complete parts a through f below. E Click the icon to view the trap spacing data. Trap Spacing Data a. Identify the target parameter for this study. The target parameter for this study is 93 101 107 95 81 68 84 b. Compute a point estimate of the target parameter. (Round to two decimal places as needed.) Print Done c. What is the problem with using the normal (z) statistic to finda confidence interval for the target parameter? O A. The point estimate is too large to…arrow_forward
arrow_back_ios
arrow_forward_ios
Recommended textbooks for you
- MATLAB: An Introduction with ApplicationsStatisticsISBN:9781119256830Author:Amos GilatPublisher:John Wiley & Sons Inc
 Probability and Statistics for Engineering and th...StatisticsISBN:9781305251809Author:Jay L. DevorePublisher:Cengage Learning
 Statistics for The Behavioral Sciences (MindTap C...StatisticsISBN:9781305504912Author:Frederick J Gravetter, Larry B. WallnauPublisher:Cengage Learning
  Elementary Statistics: Picturing the World (7th E...StatisticsISBN:9780134683416Author:Ron Larson, Betsy FarberPublisher:PEARSON
 The Basic Practice of StatisticsStatisticsISBN:9781319042578Author:David S. Moore, William I. Notz, Michael A. FlignerPublisher:W. H. Freeman
 Introduction to the Practice of StatisticsStatisticsISBN:9781319013387Author:David S. Moore, George P. McCabe, Bruce A. CraigPublisher:W. H. Freeman
MATLAB: An Introduction with Applications
Statistics
ISBN:9781119256830
Author:Amos Gilat
Publisher:John Wiley & Sons Inc
Probability and Statistics for Engineering and th...
Statistics
ISBN:9781305251809
Author:Jay L. Devore
Publisher:Cengage Learning
Statistics for The Behavioral Sciences (MindTap C...
Statistics
ISBN:9781305504912
Author:Frederick J Gravetter, Larry B. Wallnau
Publisher:Cengage Learning
Elementary Statistics: Picturing the World (7th E...
Statistics
ISBN:9780134683416
Author:Ron Larson, Betsy Farber
Publisher:PEARSON
The Basic Practice of Statistics
Statistics
ISBN:9781319042578
Author:David S. Moore, William I. Notz, Michael A. Fligner
Publisher:W. H. Freeman
Introduction to the Practice of Statistics
Statistics
ISBN:9781319013387
Author:David S. Moore, George P. McCabe, Bruce A. Craig
Publisher:W. H. Freeman