
MATLAB: An Introduction with Applications
6th Edition
ISBN: 9781119256830
Author: Amos Gilat
Publisher: John Wiley & Sons Inc
expand_more
expand_more
format_list_bulleted
Related questions
Question
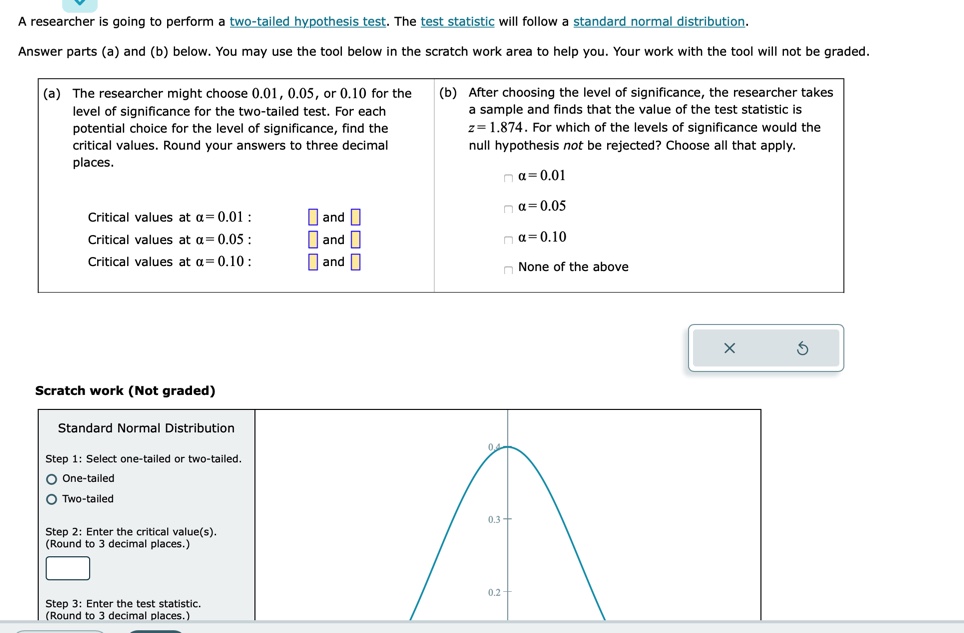

Transcribed Image Text:A researcher is going to perform a two-tailed hypothesis test. The test statistic will follow a standard normal distribution.
Answer parts (a) and (b) below. You may use the tool below in the scratch work area to help you. Your work with the tool will not be graded.
(a) The researcher might choose 0.01, 0.05, or 0.10 for the
level of significance for the two-tailed test. For each
potential choice for the level of significance, find the
critical values. Round your answers to three decimal
places.
Critical values at a = 0.01:
Critical values at a = 0.05:
Critical values at a = 0.10:
Scratch work (Not graded)
Standard Normal Distribution
Step 1: Select one-tailed or two-tailed.
O One-tailed
OTwo-tailed
Step 2: Enter the critical value(s).
(Round to 3 decimal places.)
Step 3: Enter the test statistic.
(Round to 3 decimal places.)
and
0 and
and
(b) After choosing the level of significance, the researcher takes
a sample and finds that the value of the test statistic is
z= 1.874. For which of the levels of significance would the
null hypothesis not be rejected? Choose all that apply.
nα=0.01
α=0.05
na=0.10
0.3+
0.2-
None of the above
X
Expert Solution
This question has been solved!
Explore an expertly crafted, step-by-step solution for a thorough understanding of key concepts.

Step by stepSolved in 2 steps

Knowledge Booster

Similar questions
- A researcher wants to select a sample from a population with a mean (µ)= 60 and administer a treatment to individuals in the sample. He thinks the treatment will help improve scores. a. State the hypotheses for a one-tailed test. b. For a one-tailed test, would the critical region be located in the positive or right-hand tail of the distribution, or in the negative or left-hand tail of the distribution?arrow_forwardsearch A study was conducted that resulted in the following relative frequency histogram. Determine whether or not the histogram indicates that a normal distribution could be used as a model for the variable. Yooo Choose the correct answer below. OA. The histogram is not bell-shaped, so a normal distribution could be used as a model for the variable. OB. The histogram is not bell-shaped, so a normal distribution could not be used as a model for the variable. OC. The histogram is bell-shaped, so a normal distribution could not be used as a model for the variable. OD. The histogram is bell-shaped, so a normal distribution could be used as a model for the variable. ly 144 is 4+ 2000 3000 4000 Q Q G 5000 prt sc deletearrow_forwardYou work for a soft-drink company in the quality control division. You are interested in the variance of one of your production lines as a measure of consistency. The product is intended to have a mean of 12 ounces, and your team would like the variance to be as low as possible. You gather a random sample of 16 containers. Estimate the population variance at a 80% level of confidence. 11.82 11.83 11.85 11.89 11.9 11.97 12 12 12 12.01 12.02 12.04 12.05 12.11 12.16 12.18 Variance of Data: 0.012 Note: Round all values to 3 decimals and use those rounded values in subsequent calculations. a) Find the lower and upper x critical values at 80% confidence: Lower: Upper: b) Report your confidence interval for o?: Lower Bound: Upper Bound:arrow_forward
- Image has all the dataarrow_forwardNeed crit value, the pictured question b, and rejection region.arrow_forwardA teacher would like to determine if quiz scores improve after completion of a worksheet. The students take a pre-quiz before the worksheet and then another quiz after the worksheet. (Pre-quiz score - Post-quiz score) Assume quiz scores are normally distributed. The grades for each quiz are given below. Use a significance level of a = 0.05. H₂: Hd = 0 Ha: Hd <0 pre-quiz 12 16 17 16 11 15 12 7 15 13 post-quiz 13 16 15 16 14 15 13 9 14 15 What is the test statistic? test statistic = (Report answer accurate to 2 decimal places.) What is the p-value for this sample? p-value= (Report answer accurate to 3 decimal places.) The correct decision is to Select an answer Conclusion: Select an answer that the worksheet improved quiz scores.arrow_forward
- Choose the appropriate statistical test. When computing, be sure to round each answer as indicated. A dentist wonders if depression affects ratings of tooth pain. In the general population, using a scale of 1-10 with higher values indicating more pain, the average pain rating for patients with toothaches is 6.8. A sample of 30 patients that show high levels of depression have an average pain rating of 7.1 (variance 0.8). What should the dentist determine? 1. Calculate the estimated standard error. (round to 3 decimals). [st.error] 2. What is thet-obtained? (round to 3 decimals). 3. What is the t-cv? (exact value) 4. What is your conclusion? Only type "Reject" or Retain"arrow_forwardI need help with this one please thank youarrow_forwardI need help finding the test statistic and the P-valuearrow_forward
- The means of the number of revolutions per minute of two competing engines are to be compared. Thirty engines are randomly assigned to be tested. Both populations have normal distributions. Table 10.4 shows the result. Do the data indicate that Engine 2 has higher RPM than Engine 1? Test at a 5% level of significance. Engine Sample Mean Number of RPM Population Standard Deviation 1 1,500 50 2 1,600 60arrow_forwardplease assist I am lostarrow_forward
arrow_back_ios
arrow_forward_ios
Recommended textbooks for you
- MATLAB: An Introduction with ApplicationsStatisticsISBN:9781119256830Author:Amos GilatPublisher:John Wiley & Sons Inc
 Probability and Statistics for Engineering and th...StatisticsISBN:9781305251809Author:Jay L. DevorePublisher:Cengage Learning
 Statistics for The Behavioral Sciences (MindTap C...StatisticsISBN:9781305504912Author:Frederick J Gravetter, Larry B. WallnauPublisher:Cengage Learning
  Elementary Statistics: Picturing the World (7th E...StatisticsISBN:9780134683416Author:Ron Larson, Betsy FarberPublisher:PEARSON
 The Basic Practice of StatisticsStatisticsISBN:9781319042578Author:David S. Moore, William I. Notz, Michael A. FlignerPublisher:W. H. Freeman
 Introduction to the Practice of StatisticsStatisticsISBN:9781319013387Author:David S. Moore, George P. McCabe, Bruce A. CraigPublisher:W. H. Freeman
MATLAB: An Introduction with Applications
Statistics
ISBN:9781119256830
Author:Amos Gilat
Publisher:John Wiley & Sons Inc
Probability and Statistics for Engineering and th...
Statistics
ISBN:9781305251809
Author:Jay L. Devore
Publisher:Cengage Learning
Statistics for The Behavioral Sciences (MindTap C...
Statistics
ISBN:9781305504912
Author:Frederick J Gravetter, Larry B. Wallnau
Publisher:Cengage Learning
Elementary Statistics: Picturing the World (7th E...
Statistics
ISBN:9780134683416
Author:Ron Larson, Betsy Farber
Publisher:PEARSON
The Basic Practice of Statistics
Statistics
ISBN:9781319042578
Author:David S. Moore, William I. Notz, Michael A. Fligner
Publisher:W. H. Freeman
Introduction to the Practice of Statistics
Statistics
ISBN:9781319013387
Author:David S. Moore, George P. McCabe, Bruce A. Craig
Publisher:W. H. Freeman