
MATLAB: An Introduction with Applications
6th Edition
ISBN: 9781119256830
Author: Amos Gilat
Publisher: John Wiley & Sons Inc
expand_more
expand_more
format_list_bulleted
Related questions
Question
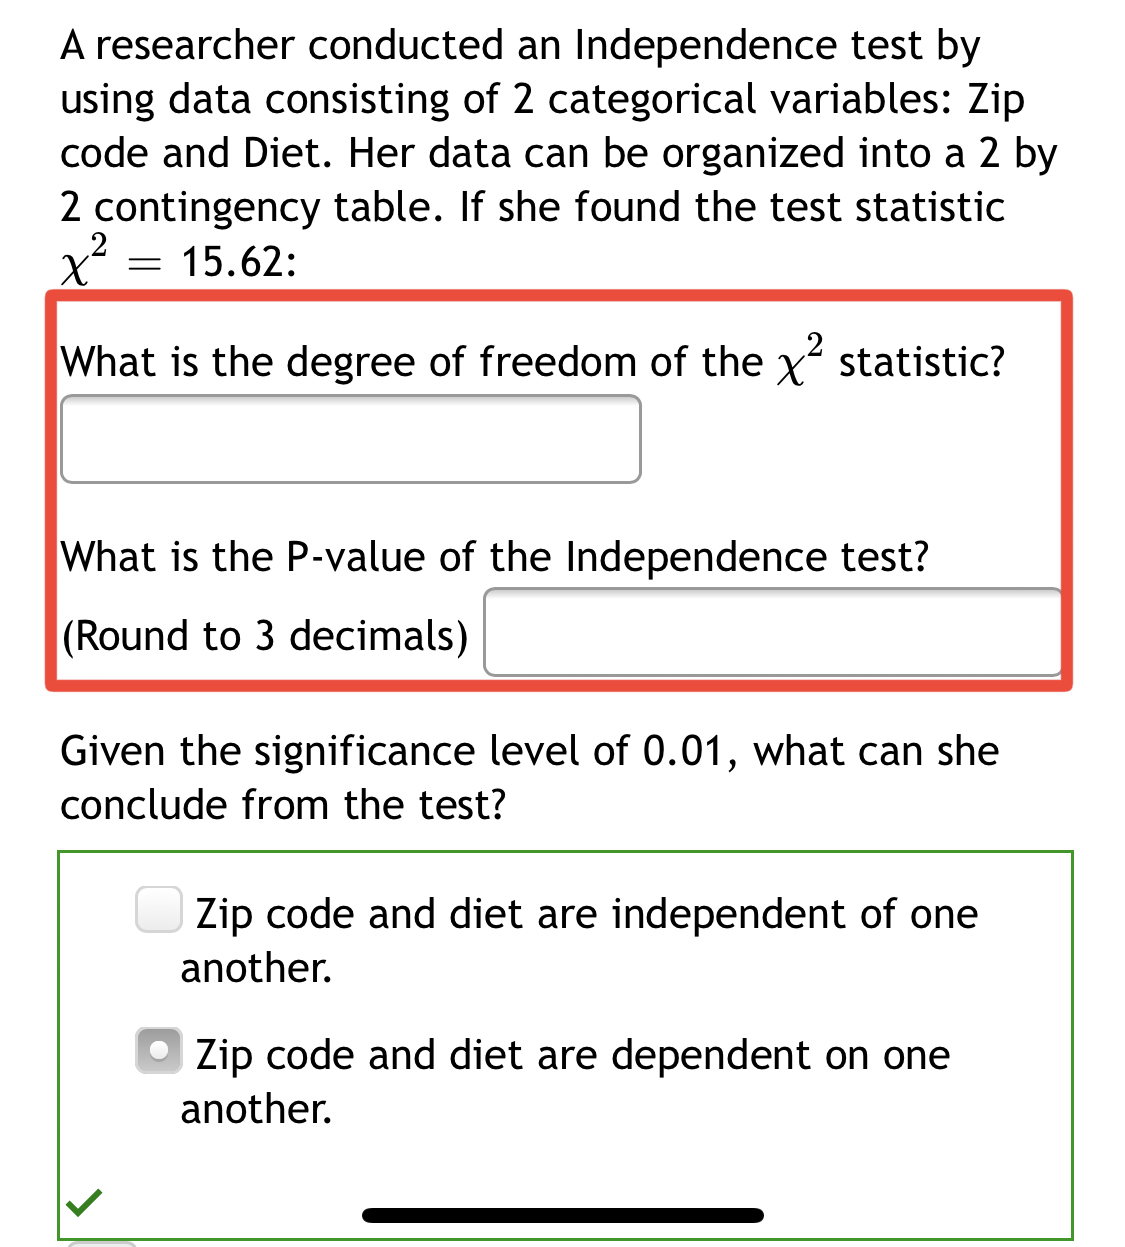

Transcribed Image Text:A researcher conducted an Independence test by
using data consisting of 2 categorical variables: Zip
code and Diet. Her data can be organized into a 2 by
2 contingency table. If she found the test statistic
x = 15.62:
What is the degree of freedom of the x statistic?
What is the P-value of the Independence test?
(Round to 3 decimals)
Given the significance level of 0.01, what can she
conclude from the test?
Zip code and diet are independent of one
another.
Zip code and diet are dependent on one
another.
Expert Solution
This question has been solved!
Explore an expertly crafted, step-by-step solution for a thorough understanding of key concepts.

This is a popular solution

Trending nowThis is a popular solution!

Step by stepSolved in 2 steps with 3 images

Knowledge Booster


Learn more about
Need a deep-dive on the concept behind this application? Look no further. Learn more about this topic, statistics and related others by exploring similar questions and additional content below.Similar questions
- Need the test statistic and p value pls help Thankyou.arrow_forwardGSS 2018 respondents were asked to rate their level of agreement to the statement, “Differences in income in America are too large.” Responses were measured on a 5-point scale: 1 = strongly agree, 2 = agree, 3 = neutral, 4 = disagree, and 5 = strongly disagree. Strong Democrats had an average score of 1.69 (s = 1.04, N = 86) while strong Republicans had an average score of 2.11 (s = 1.05, N = 67). The estimated standard error of the difference between meansis 0.17. What is the appropriate test statistic? Why? Test the null hypothesis with a one-tailed test (strong Democrats are more likely to agree with the statement than strong Republicans); α = .05. What do you conclude about the difference in attitudes for these two political groups? If you conducted a two-tailed test with α = .05, would your decision have been different?arrow_forwardB? pleasearrow_forward
- Twenty years ago, 52% of parents of children in high school felt it was a serious problem that high school students were not being taught enough math and science. A recent survey found that 281 of 800 parents of children in high school felt it was a serious problem that high school students were not being taught enough math and science. Do parents feel differently today than they did twenty years ago? Use the a=0.1 level of significance. *** Because npo (1-Po) = 199.7 less than 5% of the population size, and the sample can be reasonably assumed to be random, the 10, the sample size is requirements for testing the hypothesis are satisfied. (Round to one decimal place as needed.) D What are the null and alternative hypotheses? Ho versus H₁ (Type integers or decimals. Do not round.) Help me solve this View an example Clear all Check answer Type here to search O 1:12 PM 6/18/2022 3 1 7 Q 2 @ 7 S E C $ 4 R 06 5 T S B 6 Get more help - 18 H & N 8 M hp K a O a P 12 (?) prt sc 94°F Mostly…arrow_forwardQ3.3 Normal, but why? A meal package for use at the space station is to be prepared by combining three separate components: protein, fruit/vegetable, and grains. Each of the components is to be randomly selected. Summary values for the caloric content for each of the components are given in the table. Component Protein (P) Fruit/vegetable (F) Grain (G) Mean (calories) 120 55 84 Stdv (calories) 6.4 Save Answer 1.0 3.6 Assume that the distributions of caloric content for each of the components are approximately normally distributed. Since the meal package consists of protein, fruit/vegetable, and grains, the total caloric content of a meal package is the random variable T, where T = P + F + G. Briefly explain why it is appropriate to say that T is approximately normally distributed. Q3.4 Probability Less than 275 Calories On your own piece of paper find the approximate probability that a randomly selected meal package will have less than 269 calories? (Draw an appropriate diagram, find a…arrow_forwardFind tests statitic and p-score.arrow_forward
- A student scored between 81% and 93% on all exams except for one that she failed with a47% because she studied the wrong chapters. Which value would better represent hertypical performance: mean exam grade or median exam grade? Briefly explain.arrow_forwardWhat is the one-sample t-test for the mean? WRite it in words and formulas.arrow_forwardA statistician changes her level of significance from .001 to .05. What impact will this change have on her risk of making a Type I and Type II error? Is the change in the level of significance a good decision? Why or why not?arrow_forward
arrow_back_ios
arrow_forward_ios
Recommended textbooks for you
- MATLAB: An Introduction with ApplicationsStatisticsISBN:9781119256830Author:Amos GilatPublisher:John Wiley & Sons Inc
 Probability and Statistics for Engineering and th...StatisticsISBN:9781305251809Author:Jay L. DevorePublisher:Cengage Learning
 Statistics for The Behavioral Sciences (MindTap C...StatisticsISBN:9781305504912Author:Frederick J Gravetter, Larry B. WallnauPublisher:Cengage Learning
  Elementary Statistics: Picturing the World (7th E...StatisticsISBN:9780134683416Author:Ron Larson, Betsy FarberPublisher:PEARSON
 The Basic Practice of StatisticsStatisticsISBN:9781319042578Author:David S. Moore, William I. Notz, Michael A. FlignerPublisher:W. H. Freeman
 Introduction to the Practice of StatisticsStatisticsISBN:9781319013387Author:David S. Moore, George P. McCabe, Bruce A. CraigPublisher:W. H. Freeman
MATLAB: An Introduction with Applications
Statistics
ISBN:9781119256830
Author:Amos Gilat
Publisher:John Wiley & Sons Inc
Probability and Statistics for Engineering and th...
Statistics
ISBN:9781305251809
Author:Jay L. Devore
Publisher:Cengage Learning
Statistics for The Behavioral Sciences (MindTap C...
Statistics
ISBN:9781305504912
Author:Frederick J Gravetter, Larry B. Wallnau
Publisher:Cengage Learning
Elementary Statistics: Picturing the World (7th E...
Statistics
ISBN:9780134683416
Author:Ron Larson, Betsy Farber
Publisher:PEARSON
The Basic Practice of Statistics
Statistics
ISBN:9781319042578
Author:David S. Moore, William I. Notz, Michael A. Fligner
Publisher:W. H. Freeman
Introduction to the Practice of Statistics
Statistics
ISBN:9781319013387
Author:David S. Moore, George P. McCabe, Bruce A. Craig
Publisher:W. H. Freeman