MATLAB: An Introduction with Applications
6th Edition
ISBN: 9781119256830
Author: Amos Gilat
Publisher: John Wiley & Sons Inc
expand_more
expand_more
format_list_bulleted
Question

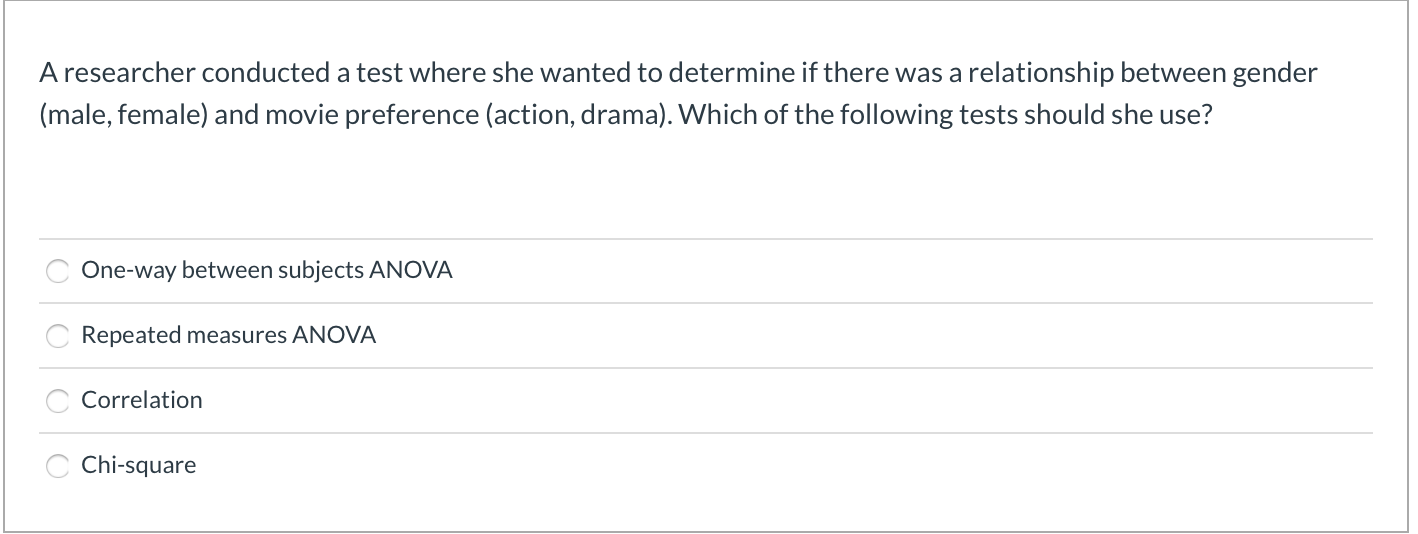
Transcribed Image Text:A researcher conducted a test where she wanted to determine if there was a relationship between gender
(male, female) and movie preference (action, drama). Which of the following tests should she use?
One-way between subjects ANOVA
Repeated measures ANOVA
Correlation
Chi-square
Expert Solution
This question has been solved!
Explore an expertly crafted, step-by-step solution for a thorough understanding of key concepts.
This is a popular solution
Trending nowThis is a popular solution!
Step by stepSolved in 3 steps

Knowledge Booster
Similar questions
- Suppose we wanted to see if there was a correlation between suspension and ethnicity. We have the following summary of data below. What statistical test would we use? Suspended Note Suspended Black 17 17 White 65 878 Group of answer choices No answer text provided. Chi-squared Z-test T-testarrow_forwardA marketing agency wanted to determine if a new commercial changed people's opinion about a company. They recruited n=30 participants to watch the commercial. First, everyone was givien a survey to determine their attitudes toward the company. Then, everyone watched the new commercial. Finally, they were given the same survey again and asked about their attitudes toward the comapny after seeing the commercial. The agency wanted to see if attitudes were changed by the commercial. What statistical test should they use?arrow_forwardthe LA Times has noticed a decline in its finances They decided to find out the key variables that affect subscriptions (people paying monthly for the newspaper) The subscription manager obtained the following sample information on 30 newspapers in the West. The following are the variables and their explanation. Subscriptions = Population Advert Income Fam size Y 37.95 37.66 37.55 38.78 37.67 38.23 36.9 38.28 38.95 39.27 38.3 38.84 38.14 Subscriptions Population 38.39 37.29 39.15 38.29 38.09 37.83 39.37 = 37.81 37.42 38.83 38.33 40.24 40.58 40.95 38.58 38.54 37.59 = X1 588.9 585.3 566.3 642.9 624.2 603.9 571.9 584.3 605 676.3 587.4 576.4 570.8 586.5 544 611.1 643.3 635.6 598.9 657 595.2 520 629.6 680 651.2 653 700.21 587 589.5 600 Number of subscriptions (in thousands) The metropolitan population ( in thousands) The advertising budget of the paper (in $ hundreds) The median family income in the metropolitan area (in $ thousands) Median family size (number of people in a family) X2 X3…arrow_forward
- For a random sample of households in the US, we record annual household income, whether the location is east or west of the Mississippi River, and number of children. We are interested in determining whether or not there is a linear relationship between household income and number of children. Part 1 (a) State the null and alternative hypotheses. Ho: II vs Ha: 44₁ :: p ₂ ^ P₁ p II :: P₁ A P₂ : 0 parrow_forwardChanning Tatum wants to know: is the average height between veterans and non-veterans different? What test should he use? One Sample T-Test Paired T-Test Two sample t test, after checking for equal variance Two Sample T-Testarrow_forwardA researcher gathered a sample of participants who volunteered for a studying of phobias. She measured anxiety level of participants as they viewed photos of spiders and again when they viewed puppies. Which statistical test is appropriate for this study and why?arrow_forward
- Think about doing an Independent-Measures ANOVA, Step 3. If the data are as follows, find the SS-between. GROUP 1 GROUP 2 GROUP 3 1 3 5 3 2 7 2 4 6 A) SS-between = 26.00 B) SS-between = 42.00 C) SS-between = 6.00 D) SS-between = 13.00arrow_forwardWhat are the values for SS and variance for the following sample of n = 3 scores? Sample: 8, 5, 2arrow_forwardA hospital administrator wants a statistic to calculate the relationship between the degree of patient satisfaction and whether that patient was treated in the ER or admitted to the hospital. one-sample t point-biserial correlation O independent-measures t sign testarrow_forward
arrow_back_ios
SEE MORE QUESTIONS
arrow_forward_ios
Recommended textbooks for you
 MATLAB: An Introduction with ApplicationsStatisticsISBN:9781119256830Author:Amos GilatPublisher:John Wiley & Sons Inc
 Probability and Statistics for Engineering and th...StatisticsISBN:9781305251809Author:Jay L. DevorePublisher:Cengage Learning
 Statistics for The Behavioral Sciences (MindTap C...StatisticsISBN:9781305504912Author:Frederick J Gravetter, Larry B. WallnauPublisher:Cengage Learning
 Elementary Statistics: Picturing the World (7th E...StatisticsISBN:9780134683416Author:Ron Larson, Betsy FarberPublisher:PEARSON
 The Basic Practice of StatisticsStatisticsISBN:9781319042578Author:David S. Moore, William I. Notz, Michael A. FlignerPublisher:W. H. Freeman
 Introduction to the Practice of StatisticsStatisticsISBN:9781319013387Author:David S. Moore, George P. McCabe, Bruce A. CraigPublisher:W. H. Freeman

MATLAB: An Introduction with Applications
Statistics
ISBN:9781119256830
Author:Amos Gilat
Publisher:John Wiley & Sons Inc

Probability and Statistics for Engineering and th...
Statistics
ISBN:9781305251809
Author:Jay L. Devore
Publisher:Cengage Learning

Statistics for The Behavioral Sciences (MindTap C...
Statistics
ISBN:9781305504912
Author:Frederick J Gravetter, Larry B. Wallnau
Publisher:Cengage Learning

Elementary Statistics: Picturing the World (7th E...
Statistics
ISBN:9780134683416
Author:Ron Larson, Betsy Farber
Publisher:PEARSON

The Basic Practice of Statistics
Statistics
ISBN:9781319042578
Author:David S. Moore, William I. Notz, Michael A. Fligner
Publisher:W. H. Freeman

Introduction to the Practice of Statistics
Statistics
ISBN:9781319013387
Author:David S. Moore, George P. McCabe, Bruce A. Craig
Publisher:W. H. Freeman