
MATLAB: An Introduction with Applications
6th Edition
ISBN: 9781119256830
Author: Amos Gilat
Publisher: John Wiley & Sons Inc
expand_more
expand_more
format_list_bulleted
Related questions
Question
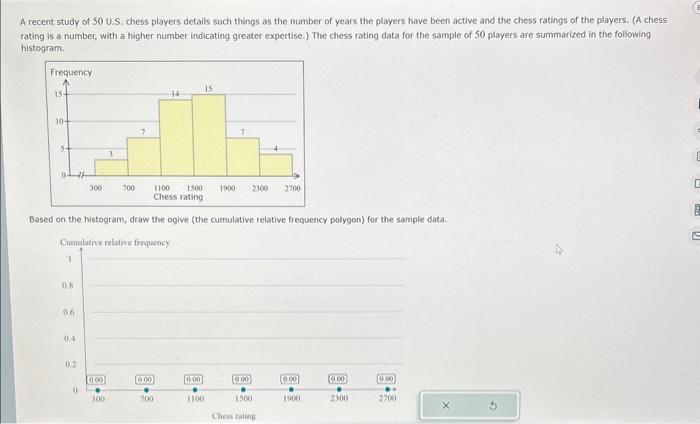

Transcribed Image Text:A recent study of 50 U.S. chess players details such things as the number of years the players have been active and the chess ratings of the players. (A chess
rating is a number, with a higher number indicating greater expertise.) The chess rating data for the sample of 50 players are summarized in the following
histogram.
Frequency
15-
10+
1
0.8
0.6
04
02
300
0
Based on the histogram, draw the ogive (the cumulative relative frequency polygon) for the sample data.
Cumulative relative frequency
0.00
3
300
700
7
1100 1500
Chess rating
000
700
15
0.00
7
1100
1900 2300 2700
000
1500
Chess rating
0.00
1900
0.00
2300
[0.00
2700
X
2
E
E
B
n
Expert Solution
This question has been solved!
Explore an expertly crafted, step-by-step solution for a thorough understanding of key concepts.

This is a popular solution

Trending nowThis is a popular solution!

Step by stepSolved in 4 steps with 3 images

Knowledge Booster

Similar questions
- College graduates in a random sample were asked the age when they earned their bachelor's degree. The data are summarized in the frequency table below. Find the mean of the sample. Submit your answer as a decimal value rounded to the nearest tenth. Frequency table: Count of the age when students graduated with a bachelor's degree Age 21 22 23 24 25 26 Frequency 1 3 4 2 O 9arrow_forwardFind the 25th, 50th, and 75th percentile from the following list of 25 observations. 12 17 24 25 26 27 43 45 49 50 52 53 55 68 70 72 76 80 84 88 90 92 93 96 100 25th percentile = 50th percentile = 75th percentile =arrow_forwardGiven below are the ages of motorcyclists at the time they were fatally injured in traffic accidents (based on data from the U.S. Department of Transportation). 18 38 23 14 18 34 16 42 28 24 40 20 23 34 37 21 32 25 17 28 33 25 23 19 51 18 29 Looking at the histogram for the data, what is the height (frequency) of the 4th bar on the histogram? Given below are the ages of motorcyclists at the time they were fatally injured in traffic accidents (based on data from the U.S. Department of Transportation). 18 38 23 14 18 34 16 42 28 24 40 20 23 34 37 21 32 25 17 28 33 25 23 19 51 18 29 Looking at the histogram for the data, what is the height (frequency) of the 4th bar on the histogram? 4 7 5 6 8arrow_forward
- for the dataset c(1,2,2,2,4,5,6,6,7,8,9,9), what is the 75% or .75 quantile?arrow_forwardThe following frequency histogram presents the final grades of a random sample of 100 college students. What is the class width?arrow_forwardIn the data set below, the frequency of is 5, 7, 1, 12, 17, 5, 1, 7, 10, 5 5 3 --- 12 15 1 3 10arrow_forward
- The following data were collected in a survey of 8th graders and summarize their cell phone status. What proportion of the 8th graders have cell phones? No cell phone Conventional cell phone Smartphone Boys 50 65 33 Girls 31 76 27arrow_forwardA data set is summarized in the frequency table below. The data set contains a total of 30 data values. What is the missing frequency? Value Frequency 1 5 2 3 3 4 4 6 5 □ 6 2 7 3 8 4arrow_forwardThe highway speeds of 100 cars are summarized in the frequency distribution below. Find the estimated mean speed. Speed (mph) 30-39 40-49 50-59 60-69 70-79 Cars 3. 16 50 18 13 O A. 59.5 mph O B. 62.4 mph O C. 22.8 mph O D. 56.7 mpharrow_forward
- Find the (a) mean, (b) median, (c) mode, and (d) midrange for the data and then (e) answer the given question. Listed below are the jersey numbers of 11 players randomly selected from the roster of a championship sports team. What do the results tell us? 15 26 89 80 37 83 73 72 32 78 70 D a. Find the mean. The mean is 59.5. (Type an integer or a decimal rounded to one decimal place as needed.) b. Find the median. The median is 72. (Type an integer or a decimal rounded to one decimal place as needed.) c. Find the mode. Select the correct choice below and, if necessary, fill in the answer box to complete your choice. OA. The mode(s) is (are) (Type an integer or a decimal. Do not round. Use a comma to separate answers as needed.) B. There is no mode. d. Find the midrange. The midrange is 52. (Type an integer or a decimal rounded to one decimal place as needed.) e. What do the results tell us? OA. The midrange gives the average (or typical) jersey number, while the mean and median give two…arrow_forwardA group of students were surveyed about the number of siblings they have. Their responses are summarized in the frequency table below. How many students responded to the survey? Number of Siblings Frequency 0 6 1 8 2 5 3 3 4 1 5 or more 3arrow_forwardDetermine what the key terms refer to in the following study. We want to know the average (mean) amount of money first year college students spend at ABC College on school supplies that do not include books. We randomly surveyed 100 first year students at the college. Three of those students spent $150, $200, and $225, respectively.arrow_forward
arrow_back_ios
SEE MORE QUESTIONS
arrow_forward_ios
Recommended textbooks for you
- MATLAB: An Introduction with ApplicationsStatisticsISBN:9781119256830Author:Amos GilatPublisher:John Wiley & Sons Inc
 Probability and Statistics for Engineering and th...StatisticsISBN:9781305251809Author:Jay L. DevorePublisher:Cengage Learning
 Statistics for The Behavioral Sciences (MindTap C...StatisticsISBN:9781305504912Author:Frederick J Gravetter, Larry B. WallnauPublisher:Cengage Learning
  Elementary Statistics: Picturing the World (7th E...StatisticsISBN:9780134683416Author:Ron Larson, Betsy FarberPublisher:PEARSON
 The Basic Practice of StatisticsStatisticsISBN:9781319042578Author:David S. Moore, William I. Notz, Michael A. FlignerPublisher:W. H. Freeman
 Introduction to the Practice of StatisticsStatisticsISBN:9781319013387Author:David S. Moore, George P. McCabe, Bruce A. CraigPublisher:W. H. Freeman
MATLAB: An Introduction with Applications
Statistics
ISBN:9781119256830
Author:Amos Gilat
Publisher:John Wiley & Sons Inc
Probability and Statistics for Engineering and th...
Statistics
ISBN:9781305251809
Author:Jay L. Devore
Publisher:Cengage Learning
Statistics for The Behavioral Sciences (MindTap C...
Statistics
ISBN:9781305504912
Author:Frederick J Gravetter, Larry B. Wallnau
Publisher:Cengage Learning
Elementary Statistics: Picturing the World (7th E...
Statistics
ISBN:9780134683416
Author:Ron Larson, Betsy Farber
Publisher:PEARSON
The Basic Practice of Statistics
Statistics
ISBN:9781319042578
Author:David S. Moore, William I. Notz, Michael A. Fligner
Publisher:W. H. Freeman
Introduction to the Practice of Statistics
Statistics
ISBN:9781319013387
Author:David S. Moore, George P. McCabe, Bruce A. Craig
Publisher:W. H. Freeman